
Abstract: on Monday, the S & P 500 index returned to the 3,000-point round mark, approaching an all-time high of 3027, but the trading volume of US stocks shrank to a near 10-year low, deviating from the rise of US stocks. Analysts worry that if selling pressure resumes, it may repeat the nearly 20% plunge at the end of last year. Michael Burry, a big bear, expressed a similar view early last month that index funds were about to collapse like CDO, which triggered the subprime crisis a decade ago, because of a lack of liquidity.
1. The trading volume of S & P 500 shares fell to a 10-year low.
Source: marketwatch
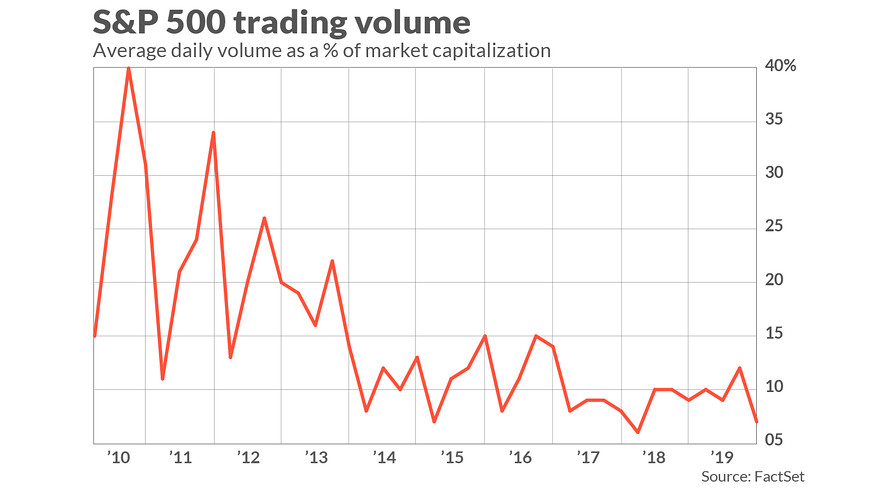
The average daily trading volume of s & p 500 stocks in the three months to Oct. 19 was only 7% of total market capitalization, close to a decade low, MarketWatch reported. By contrast, the average daily trading volume of S & P 500 stocks in 2010-2013 was 21 per cent of total market capitalization.Tim Quast, president of ModernIR, said the figures were shocking (astonishing). One of the potential risks is that if the market comes under pressure, there will be a shortage of buyers, and another risk is that illiquidity will lead to firesale.
Source: marketwatch
The liquidity decline in the S & P 500s can also be seen from another ModernIR data showing that the average number of shares per transaction has fallen from 248 shares in 2015 to 133 shares today.Quast noted that the fourth quarter of 2018 highlighted the risk of illiquidity. The s & p 500 pulled back at the end of last year, and although the share price fell to an attractive price, the decline worsened due to lack of buying, plunging nearly 20%.
Jerry Lucas, a senior trading strategist at UBS Global Wealth Management, said that the rise of high-frequency trading algorithms has gradually become a "market maker" and a headache for traders. When there is no news, algorithmic trading provides plenty of liquidity, and once there is big news, the algorithm disappears, waiting for the storm to subside.
These data are consistent with the latest report by Bank of America Corporation's chief stock and quantitative strategist Savita Subramanian.She worries that the trading volume of large US stocks is increasingly dependent on "non-basic investors", including algorithmic investment funds, passive investment funds and high-frequency traders.

Savita Subramanian believes that banks no longer provide links with[Before the Great Financial crisis]With the same liquidity, the result is that the average bid-ask spread of S & P 500 stocks is close to multi-year highs. "the bid-ask difference is the difference between the offer for the immediate purchase of an asset (buy one) and the offer for immediate sale (sell one).

However, some people retort that stock trading volume alone does not represent the overall situation of the S & P 500, and that related derivatives are becoming more and more important, such as ETF, futures, options and so on. But ModernIR's Quast stressed that you can't rest assured that the derivatives market is stable, because it is these increasingly illiquid securities on which the derivatives market is based.
2. Big short Michael Burry: lack of liquidityThe $4.27 trillion ETF is going to collapse.
MichaelBurry, a big short seller on Wall Street, expressed a similar view about the risk of stock liquidity in early September, arguing that it was ETF that triggered the next market crash because ETF lacked liquidity, just like CDO, which triggered the subprime crisis a decade ago.

In fact, index investment and ETF are not new. Berg of Vanguard Fund first advocated index investment in the 1970s, but the rise of ETF and index investment into a "large-scale" financial phenomenon is only in recent years.

In August, the US stock market made history, with passively invested equity funds' AUM (assets under management)-- including mutual funds and ETF-- surpassing the AUM of active funds. The passive fund is currently $4.27 trillion, while the active fund is $4.25 trillion. This is the first time in the history of mankind.

So why did Burry say that ETF would collapse? The answer is liquidity!
Burry believes that, as before the subprime crisis, when house prices rise, there is no problem. The past decade has also been a bull market in the United States, but when the US economy starts to go down and the stock market turns down, ETF will collapse due to lack of liquidity.
Burry gives an example, "for example, in the Russell 2000 index, the vast majority of stocks are low-volume, low-value stocks." Today, I counted 1049 stocks that were worth less than $5 million that day. That proportion is more than half, and nearly half of them-456 stocks-traded less than $1 million on the day. However, hundreds of billions of dollars are linked to such stocks through indexation and passive investment.
The S & P 500 is no exception, which contains the world's largest stocks, but still has 266 stocks (more than half) with a market capitalization of less than $150 million. That sounds like a lot, but trillions of dollars of global assets are linked to these stocks. There are more and more people in the theatre, but the exit door is still the same. All this gets worse when you enter the less liquid global equity and bond markets. "
3. Summary
Unlike the reasons for bearish US stocks, such as inverted US bond yields, falling corporate profit margins and high valuations, the lack of liquidity is a new point of view. The editor believes that the lack of liquidity is not the main reason for the decline in US stocks, but it will increase the extent of decline in the market when US stocks really fall, because there is no trading volume and no one takes the offer. Interestingly, amid the "short singing" sound, the S & P 500 stood above 3000, only one step away from its all-time high of 3027.