
Source: Sansi Society
Author: London trader
Buffett's "finger sucking mistake"?
Recently, Buffett's Berkshire has hoarded as much as $122 billion in cash and missed a number of major investment opportunities in the past decade, causing a number of investors to be dissatisfied and began to sell the company's shares.
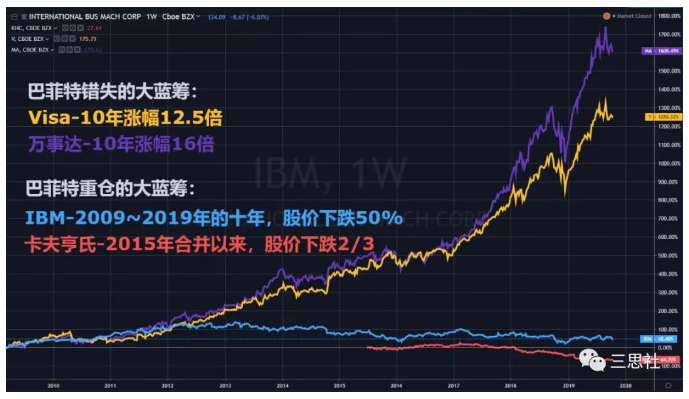
In a letter to investors in the third quarter of this year, Rolf, Berkshire's long-time shareholder and chief investment officer of Wedgewood Partners, complained that Buffett's heavy positions of IBM and Kraft Heinz left the market at huge losses in the past few years, but held extremely light positions in MasterCard and Visa Inc, which were more than ten times larger in the past decade.
In Buffett's own words, he made the mistake of "sucking his finger", that is, seeing the opportunity and doing nothing.
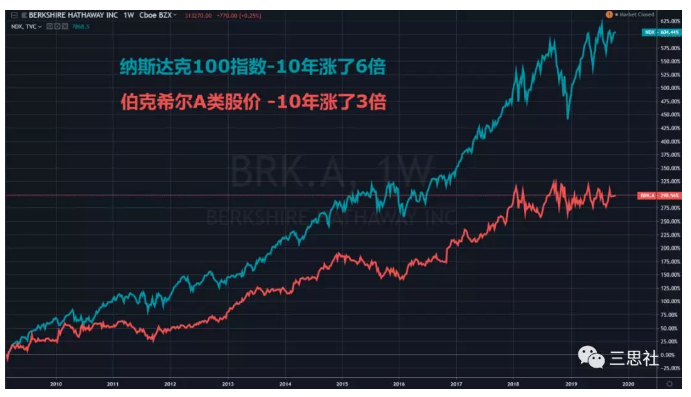
Of course, the biggest regret of the stock god may be that he is insensitive to technology stocks and missed the big bull market of technology stocks over the past decade. As a result, technology stocks led by FAAMG (NASDAQ 100) outperformed Berkshire by a large margin, and Buffett himself has repeatedly expressed regret.
However, today we do not rub Buffett's hot spots, do not care about what the stock god has missed, but wonder why the stock god is hoarding such a huge amount of cash at this time.
You know, as a world-famous investment mogul, Buffett has always had no preference for cash, even if holding cash is waiting for a good opportunity to enter. In a letter to investors in 1998, he wrote: cash never makes us happy ("Cash never makes us happy.").

Today, Berkshire holds $122 billion in cash, accounting for more than 50% of the market capitalization of its stock holdings (nearly $200 billion), a proportion that only occurred before the financial crisis.


Buffett has a famous saying:'I am greedy when others are afraid'. But greed needs bullets to fight.
Buffett hoarded a lot of cash in good times, and when the financial crisis hit, he made a lot of money by 'lending' to troubled quality companies such as Goldman Sachs Group and General Electric Co.
This time Buffett's huge amount of cash seems to send the same signal: the stock market is not cheap and there is a lack of good opportunities.
Buffett has a well-known 'stock god index', which measures the degree of bubble in U. S. stock valuations as a percentage of GDP (chart below).
The index reached 146% before the dotcom bubble burst in 2001, 135% before the financial crisis in 2007, and now it has exceeded 140% again. It has even exceeded the highs of the previous two financial cycles (but there are other reasons, such as low interest rates).

In addition to hoarding cash, Berkshire also sold net in the stock market in the first half of this year (bottom chart). In addition, Buffett has not done corporate mergers and acquisitions for several years, and the scale of share buybacks is also declining in the second quarter.

Buffett, who is good at going against the trend, why is Buffett sitting on the cash pile now? Is the old man timid, or is he waiting for something?
We don't know what Buffett is thinking. But judging from some technical indicators, it does make many investors reluctant to pay for the high valuations of U. S. stocks.
Indicator 1: counter-reference
Short positions in the S & P hit a new low of more than a year (the so-called counter-reference). Usually when the index hits bottom, there is a pullback in U. S. stocks. (the latest survey of Merrill Lynch fund managers can also be used for reference, but we will not make it public because of copyright reasons.)

Indicator 2: hard indicator
Despite recent signs of a pick-up in the US housing market, the manufacturing sector is still slowing at an accelerated pace, and it is hard for US stocks to stay strong at current highs if the Fed is hesitant to cut interest rates.
 Markets are starting to worry that technology stocks with high growth and high valuations as a 'selling point' may face a downward inflection point if the Fed fails to keep up with the pace of the economic downturn.

Indicator 3: soft indicator
Soft indicators of the US economy are now a rare departure from the S & P 500. Historically, similar deviations have always ended with a pullback in US stocks. The current data seem to mean that once u.s. stocks pull back, the adjustment will be more than 10%, or even 20%.

Among the soft indicators, the decline in consumer confidence index is the most obvious. In particular, the deviation between the two major consumer confidence indicators in the United States has reached its highest level in 50 years. Don't forget that every time the divergence between these two indices hits bottom, the US economy goes into recession.

To be clear, the Michigan Consumer sentiment Index focuses on measuring consumers' own consumer confidence, while the Conference on Consumer confidence Index (Conference Board) focuses on measuring consumer confidence in the U.S. Economy.
In view of this, Americans are still optimistic about the overall economic situation, but not so optimistic about their own consumption prospects.
It is worth mentioning that the Chamber of Commerce Consumer confidence Index has a strong forward-looking guidance on the relative trend of momentum stocks and value stocks in the United States (left). According to this logic, American high-energy stocks may lose out to value stocks (right below).

This coincides with the following chart of turning points in the economic cycle that has been widely circulated overseas recently: the outbreak of an economic crisis is usually accompanied by a decline in consumer confidence (a decline in the numerator ↓) and a rise in unemployment (a rise in the denominator ↑).
Now, as the Chamber of Commerce consumer confidence index has shown a downward trend (numerator decline ↓), the market is also increasingly worried about the indestructible US unemployment rate (denominator).

Sanshi reveals a 'secret' that is not familiar to the Chinese macro circle here.
For the unemployment rate, the real leading indicator is the number of job vacancies (Jolts), not the number of initial jobless claims (Initial Claims) as widely believed by domestic investors. Because once the economy is bad and the stock market is weak, management will boost performance and share prices by cutting capital spending, which will reduce the number of job openings first (followed by layoffs).
Since the beginning of this year, the US job vacancy data has been declining (the green line below), although it has not yet reflected the unemployment rate, but consumers have already felt that the wind in the job market is changing. Once consumers are pessimistic about the employment situation, they will cut spending, leading to a decline in retail sales data (see the growth rate of food and beverage retail sales below, light blue line).

The US retail sales data released last Wednesday fell 0.3 per cent month-on-month, below market expectations, basically confirming the above logic. While the data is not too bad, it is enough to shake the Fed's previous optimism about US jobs and consumption and re-examine its indecision to cut interest rates.

As US employment and consumption data begin to deteriorate, it may eventually prompt the Fed to accelerate interest rate cuts.
A timely rate cut by the Fed will not only save US financial markets from plummeting (but also make the general election leader happy) and avoid a bad cycle for the economy (the US economy is heavily affected by financial markets, especially the stock market, which has pulled down PMI data every time US stocks have fallen in the past). It can also weaken the dollar and benefit emerging markets.
Recently, many people in China have been making fun of the Shanghai Composite Index, which has advanced only a little in the past decade (below).
To be exact, it did not rise 1 point, but fell 100 points: on October 19, 2009, the Shanghai Composite Index closed at 3038 points, and on October 18, 2019, the Shanghai Composite Index closed at 2938 points. (however, due to the "distortion" of the stock index, it is OK to joke, but it is naive.)

As everyone knows, U. S. stocks, which have been bullish for a decade after the financial crisis, have actually experienced two 'difficult' periods in which they have not risen for 20 years.

Now that the shrewd Buffett is sitting on the cash pile, is the cycle of "not bright in the west and bright in the east" coming? Or is the replacement of the new and the old coming in the big era?
Just wait and see what happens.
Edit / Phoebe