
 行业方面,有色金属涨幅领先,TMT、军工表现落后。其中,周期板块涨幅最大,规模以上基金平均上涨4.89%。相反,国防军工板块跌幅最深,规模以上基金平均下跌1.68%。
The overall capital holdings of large-scale ETFs were reduced this week
I. Market Overview
This week (April 1 to April 3), due to the pre-holiday effect, A-shares were dominated by a weak pullback. They rose strongly on April 1, then declined for the next two days. The equity market as a whole rose, and the small-cap value was relatively leading. Driven by cyclical stocks, the Shanghai Composite Index performed well this week, rising 0.92% weekly. The Shanghai and Shenzhen 300 Index has accumulated a cumulative increase of 0.865 this week. The Shenzhen Development Index and the GEM Index rose 1.53% and 1.22% respectively this week.
 In terms of industry, non-ferrous metals are leading in growth, while TMT and military industries are lagging behind. Among them, the cyclical sector saw the biggest increase, with an average increase of 4.89% for larger funds. In contrast, the defense and military sector experienced the deepest decline, with funds above the size falling by an average of 1.68%.
There was an overall upward trend in the bond market this week. Short-term bond funds averaged 0.06%, medium- and long-term bond funds earned 0.08%; overall positive returns on the equity base; in the convertible bond market, convertible bond funds received positive returns on average.
In overseas markets, US stocks S&P and NASDAQ are generally stable. There was a big dive on Thursday. The Dow Jones weekly decline once fell nearly 2%, and the Dow fell 0.7% weekly after rebounding on Friday.
II. Capital flow
The overall net capital inflow of the ETF market this week was 3.821 billion yuan. Among them, commodity ETFs, bond ETFs, and currency ETFs had the highest net inflows. Equity ETFs had a net outflow of 1,407 billion yuan in the current period, with an average net unit value increase of 0.97%.
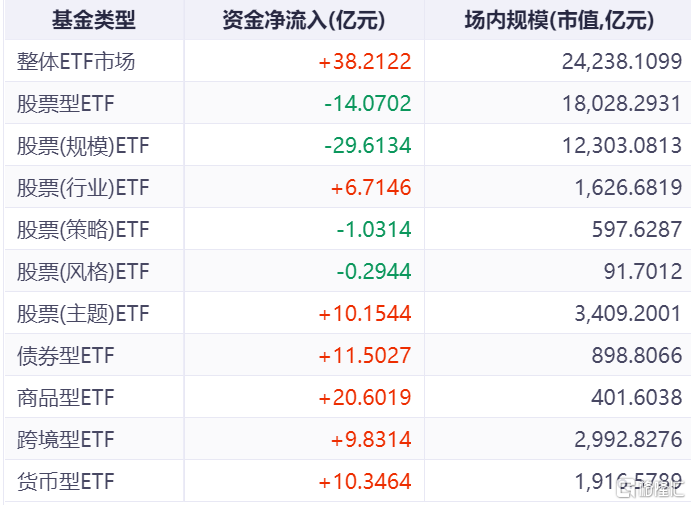
Specifically, the commodity ETF sector had the largest capital inflow, with a net capital inflow of 2.06 billion yuan throughout the week. In contrast, the small and medium capitalization index sector had the largest capital outflow, with a net capital outflow of 3,508 billion yuan throughout the week.
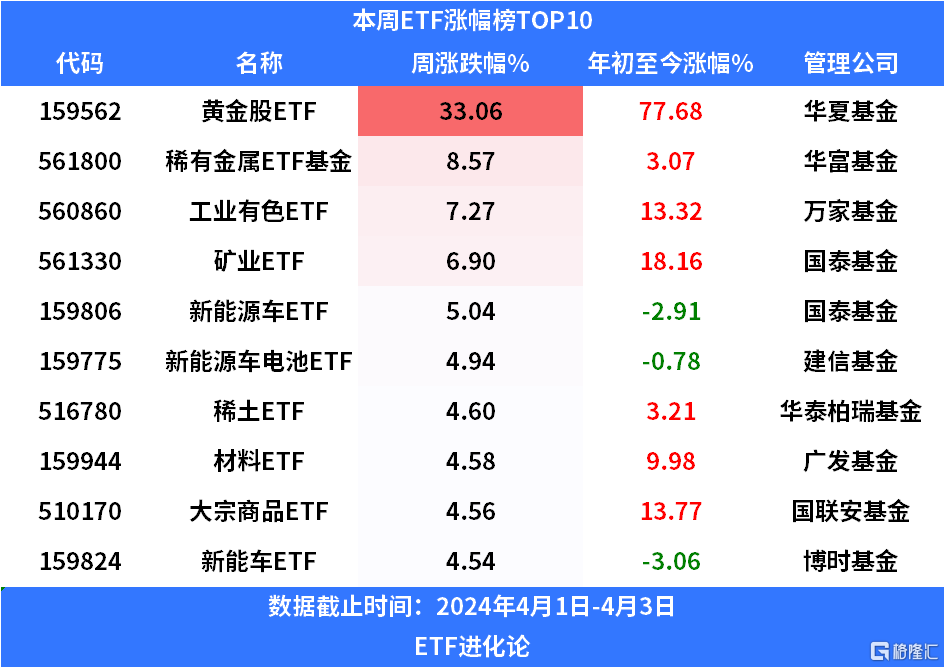
III. The rise and fall rate of ETFs
Active equity funds in the entire market have an average return of 0.71%; cyclical sector funds lead the way as a whole, and TMT and pharmaceutical funds lag behind.
Of the 897 ETFs in the global market last week, 594 ETFs showed positive weekly gains, with an average increase of 1.49%. The weekly gains of 253 ETFs were negative, with an average decline of 1.1%.
Specifically, the resources sector performed the best this week. Huaxia Fund's gold stock ETF rose as high as 33.06% per week, while Huafu Fund's rare metal ETF fund, Wanjia Fund industrial non-ferrous ETF, and Cathay Pacific Fund mining ETF increased 8.57%, 7.27%, and 6.9%, respectively.
In terms of decline, the performance of cross-border ETFs was weak. Harvest Fund's S&P Biotech ETF, Bosch Fund NASDAQ 100 ETF, and Nikkei 225 ETF eFunda declined by 4.49%, 4.16%, and 3.07% respectively this week.

IV. Changes in fund shares
Looking at the increase in ETF shares, the shares of the Medicine-themed ETF have once again bottomed out. E-Fangda Fund Pharmaceutical ETF, Huabao Fund Healthcare ETF, and Huaxia Fund Hang Seng Pharma ETF increased their shares by 542 million shares, 185 million shares, and 183 million shares respectively this week.
Capital continues to increase broad-based index ETFs. The shares of Huaxia Fund Shanghai Securities 50 ETF, Huatai Berry Fund Shanghai and Shenzhen 300 ETF, and Huaxia Fund Science and Technology Innovation 50 ETF increased their shares by 494 million shares, 335 million shares, and 216 million shares respectively this week.
Conservative capital also continues to favor dividend-themed ETFs and gold ETFs. Huatai Berry Fund's low-wave dividend ETF and Huaan Fund gold ETF increased their shares by 461 million and 195 million shares respectively this week.

Shares declined quite rarely. Actually, all of the top ranking were broad-based index ETFs, Wells Fargo Fund SSE ETF, China Southern Fund China Securities 500 ETF, Hua'an Fund GEM ETF, E-Fangda Fund China A50 ETF, E-Fangda Fund H-share ETF, Huitianfu Fund MSCI China A50 ETF, and Huitianfu Fund 800 ETF shares decreased by 372 million shares, 350 million shares, 330 million shares, 206 million shares, 203 million shares, 199 million shares, 184 million shares, and 157 million shares, respectively.

5. Emerging ETF products
On April 4, Morgan Asset Management issued an announcement stating that its subsidiary, the Morgan China Securities A50 ETF Initiated Linked Fund, was formally established with a fundraising scale of 288.328 million yuan, and was the first to open daily claims since April 8.
6. Hot news
The gold ETF held by Qiaoshui (China) is as high as 987 million yuan, or has already made a huge profit of 300 million yuan
The annual reports of the three gold ETFs show that products under “Qiaoshui (China)” continue to firmly hold gold ETFs. According to the annual report of Bosch Gold ETF, at the end of 2023, the Qiaoshui All-Weather Enhanced China Private Equity Investment Fund No. 3, and the Qiaoshui All-Weather Enhanced China Private Equity Investment Fund No. 2 funds held 46.624,800 shares, 9.294,200 shares, and 8.7106 million shares respectively, ranking the first, second, and fourth largest holders other than ETF-linked funds.
Bank of Japan Governor Kazuo Ueda: We will not start reducing the Bank of Japan's large-scale ETF holdings anytime soon.
Huijin ranked among the top ten holders of nine funds, holding more than 40 billion shares
According to Wind data, as of the end of 2023, Central Huijin Investment Co., Ltd. was the top ten holder of 9 funds in the market, with a total share of 40.13 billion shares. The total number of holdings in 2023 increased by about 13.139 billion shares. The average holding ratio was 34.60%, and the average holding ratio increased by 3.43%.
