
Despite an already strong run, Caihong Display Devices Co.,Ltd. (SHSE:600707) shares have been powering on, with a gain of 26% in the last thirty days. Looking back a bit further, it's encouraging to see the stock is up 71% in the last year.
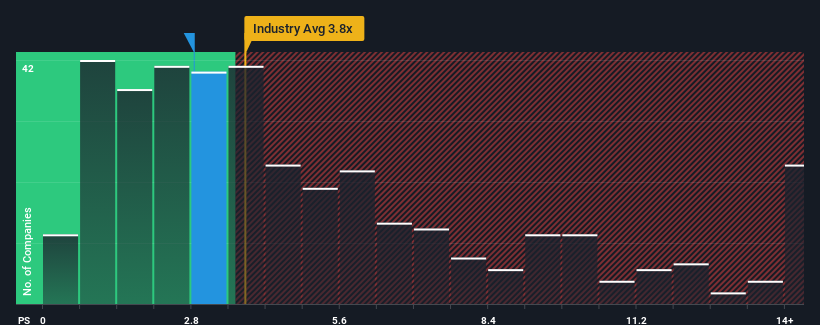
Although its price has surged higher, Caihong Display DevicesLtd may still be sending buy signals at present with its price-to-sales (or "P/S") ratio of 2.8x, considering almost half of all companies in the Electronic industry in China have P/S ratios greater than 3.8x and even P/S higher than 8x aren't out of the ordinary. However, the P/S might be low for a reason and it requires further investigation to determine if it's justified.
What Does Caihong Display DevicesLtd's Recent Performance Look Like?
The revenue growth achieved at Caihong Display DevicesLtd over the last year would be more than acceptable for most companies. It might be that many expect the respectable revenue performance to degrade substantially, which has repressed the P/S. Those who are bullish on Caihong Display DevicesLtd will be hoping that this isn't the case, so that they can pick up the stock at a lower valuation.
Although there are no analyst estimates available for Caihong Display DevicesLtd, take a look at this free data-rich visualisation to see how the company stacks up on earnings, revenue and cash flow.What Are Revenue Growth Metrics Telling Us About The Low P/S?
Caihong Display DevicesLtd's P/S ratio would be typical for a company that's only expected to deliver limited growth, and importantly, perform worse than the industry.
If we review the last year of revenue growth, the company posted a terrific increase of 18%. Revenue has also lifted 28% in aggregate from three years ago, mostly thanks to the last 12 months of growth. So we can start by confirming that the company has actually done a good job of growing revenue over that time.
Comparing the recent medium-term revenue trends against the industry's one-year growth forecast of 24% shows it's noticeably less attractive.
With this in consideration, it's easy to understand why Caihong Display DevicesLtd's P/S falls short of the mark set by its industry peers. It seems most investors are expecting to see the recent limited growth rates continue into the future and are only willing to pay a reduced amount for the stock.
What Does Caihong Display DevicesLtd's P/S Mean For Investors?
Caihong Display DevicesLtd's stock price has surged recently, but its but its P/S still remains modest. We'd say the price-to-sales ratio's power isn't primarily as a valuation instrument but rather to gauge current investor sentiment and future expectations.
As we suspected, our examination of Caihong Display DevicesLtd revealed its three-year revenue trends are contributing to its low P/S, given they look worse than current industry expectations. At this stage investors feel the potential for an improvement in revenue isn't great enough to justify a higher P/S ratio. If recent medium-term revenue trends continue, it's hard to see the share price experience a reversal of fortunes anytime soon.
Plus, you should also learn about this 1 warning sign we've spotted with Caihong Display DevicesLtd.
If strong companies turning a profit tickle your fancy, then you'll want to check out this free list of interesting companies that trade on a low P/E (but have proven they can grow earnings).
Have feedback on this article? Concerned about the content? Get in touch with us directly. Alternatively, email editorial-team (at) simplywallst.com.
This article by Simply Wall St is general in nature. We provide commentary based on historical data and analyst forecasts only using an unbiased methodology and our articles are not intended to be financial advice. It does not constitute a recommendation to buy or sell any stock, and does not take account of your objectives, or your financial situation. We aim to bring you long-term focused analysis driven by fundamental data. Note that our analysis may not factor in the latest price-sensitive company announcements or qualitative material. Simply Wall St has no position in any stocks mentioned.