
 Yahoo Finance
 Is There An Opportunity With IQVIA Holdings Inc.'s (NYSE:IQV) 28% Undervaluation?
Key Insights
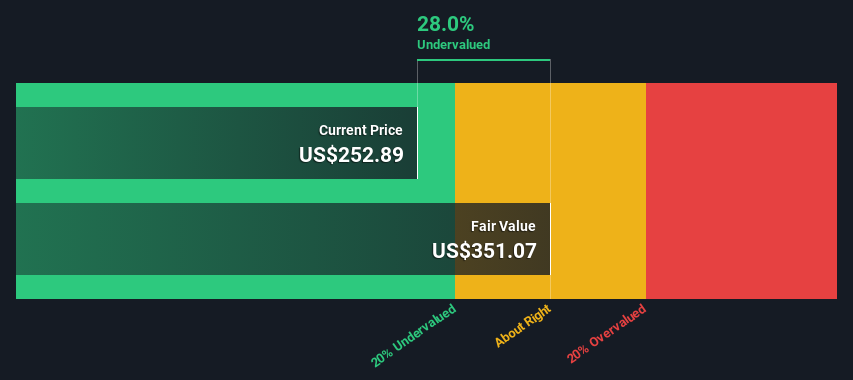
Using the 2 Stage Free Cash Flow to Equity, IQVIA Holdings fair value estimate is US$351
Current share price of US$253 suggests IQVIA Holdings is potentially 28% undervalued
The US$274 analyst price target for IQV is 22% less than our estimate of fair value
Does the March share price for IQVIA Holdings Inc. (NYSE:IQV) reflect what it's really worth? Today, we will estimate the stock's intrinsic value by taking the expected future cash flows and discounting them to their present value. We will take advantage of the Discounted Cash Flow (DCF) model for this purpose. It may sound complicated, but actually it is quite simple!
We generally believe that a company's value is the present value of all of the cash it will generate in the future. However, a DCF is just one valuation metric among many, and it is not without flaws. If you still have some burning questions about this type of valuation, take a look at the Simply Wall St analysis model.
Check out our latest analysis for IQVIA Holdings
Is IQVIA Holdings Fairly Valued?
We are going to use a two-stage DCF model, which, as the name states, takes into account two stages of growth. The first stage is generally a higher growth period which levels off heading towards the terminal value, captured in the second 'steady growth' period. In the first stage we need to estimate the cash flows to the business over the next ten years. Where possible we use analyst estimates, but when these aren't available we extrapolate the previous free cash flow (FCF) from the last estimate or reported value. We assume companies with shrinking free cash flow will slow their rate of shrinkage, and that companies with growing free cash flow will see their growth rate slow, over this period. We do this to reflect that growth tends to slow more in the early years than it does in later years.
Generally we assume that a dollar today is more valuable than a dollar in the future, so we discount the value of these future cash flows to their estimated value in today's dollars:
10-year free cash flow (FCF) estimate
2024 | 2025 | 2026 | 2027 | 2028 | 2029 | 2030 | 2031 | 2032 | 2033 | |
Levered FCF ($, Millions) | US$1.73b | US$2.13b | US$2.41b | US$2.95b | US$3.26b | US$3.49b | US$3.68b | US$3.85b | US$4.00b | US$4.14b |
Growth Rate Estimate Source | Analyst x7 | Analyst x6 | Analyst x4 | Analyst x3 | Analyst x3 | Est @ 7.05% | Est @ 5.62% | Est @ 4.62% | Est @ 3.92% | Est @ 3.43% |
Present Value ($, Millions) Discounted @ 7.2% | US$1.6k | US$1.9k | US$2.0k | US$2.2k | US$2.3k | US$2.3k | US$2.3k | US$2.2k | US$2.1k | US$2.1k |
("Est" = FCF growth rate estimated by Simply Wall St)
Present Value of 10-year Cash Flow (PVCF) = US$21b
The second stage is also known as Terminal Value, this is the business's cash flow after the first stage. For a number of reasons a very conservative growth rate is used that cannot exceed that of a country's GDP growth. In this case we have used the 5-year average of the 10-year government bond yield (2.3%) to estimate future growth. In the same way as with the 10-year 'growth' period, we discount future cash flows to today's value, using a cost of equity of 7.2%.
Terminal Value (TV)= FCF2033 × (1 + g) ÷ (r – g) = US$4.1b× (1 + 2.3%) ÷ (7.2%– 2.3%) = US$86b
Present Value of Terminal Value (PVTV)= TV / (1 + r)10= US$86b÷ ( 1 + 7.2%)10= US$43b
The total value is the sum of cash flows for the next ten years plus the discounted terminal value, which results in the Total Equity Value, which in this case is US$64b. The last step is to then divide the equity value by the number of shares outstanding. Relative to the current share price of US$253, the company appears a touch undervalued at a 28% discount to where the stock price trades currently. Remember though, that this is just an approximate valuation, and like any complex formula - garbage in, garbage out.
The Assumptions
Now the most important inputs to a discounted cash flow are the discount rate, and of course, the actual cash flows. You don't have to agree with these inputs, I recommend redoing the calculations yourself and playing with them. The DCF also does not consider the possible cyclicality of an industry, or a company's future capital requirements, so it does not give a full picture of a company's potential performance. Given that we are looking at IQVIA Holdings as potential shareholders, the cost of equity is used as the discount rate, rather than the cost of capital (or weighted average cost of capital, WACC) which accounts for debt. In this calculation we've used 7.2%, which is based on a levered beta of 1.069. Beta is a measure of a stock's volatility, compared to the market as a whole. We get our beta from the industry average beta of globally comparable companies, with an imposed limit between 0.8 and 2.0, which is a reasonable range for a stable business.
SWOT Analysis for IQVIA Holdings
Strength
Earnings growth over the past year exceeded the industry.
Debt is well covered by earnings.
Weakness
Earnings growth over the past year is below its 5-year average.
Opportunity
Annual earnings are forecast to grow for the next 3 years.
Trading below our estimate of fair value by more than 20%.
Threat
Debt is not well covered by operating cash flow.
Annual earnings are forecast to grow slower than the American market.
Looking Ahead:
Valuation is only one side of the coin in terms of building your investment thesis, and it shouldn't be the only metric you look at when researching a company. DCF models are not the be-all and end-all of investment valuation. Instead the best use for a DCF model is to test certain assumptions and theories to see if they would lead to the company being undervalued or overvalued. For example, changes in the company's cost of equity or the risk free rate can significantly impact the valuation. What is the reason for the share price sitting below the intrinsic value? For IQVIA Holdings, we've put together three fundamental factors you should look at:
Risks: For instance, we've identified 2 warning signs for IQVIA Holdings (1 is potentially serious) you should be aware of.
Future Earnings: How does IQV's growth rate compare to its peers and the wider market? Dig deeper into the analyst consensus number for the upcoming years by interacting with our free analyst growth expectation chart.
Other High Quality Alternatives: Do you like a good all-rounder? Explore our interactive list of high quality stocks to get an idea of what else is out there you may be missing!
PS. The Simply Wall St app conducts a discounted cash flow valuation for every stock on the NYSE every day. If you want to find the calculation for other stocks just search here.
Have feedback on this article? Concerned about the content? Get in touch with us directly. Alternatively, email editorial-team (at) simplywallst.com.
This article by Simply Wall St is general in nature. We provide commentary based on historical data and analyst forecasts only using an unbiased methodology and our articles are not intended to be financial advice. It does not constitute a recommendation to buy or sell any stock, and does not take account of your objectives, or your financial situation. We aim to bring you long-term focused analysis driven by fundamental data. Note that our analysis may not factor in the latest price-sensitive company announcements or qualitative material. Simply Wall St has no position in any stocks mentioned.
