
Hylink Digital Solutions Co.,Ltd (SHSE:603825) shareholders won't be pleased to see that the share price has had a very rough month, dropping 34% and undoing the prior period's positive performance. The drop over the last 30 days has capped off a tough year for shareholders, with the share price down 37% in that time.
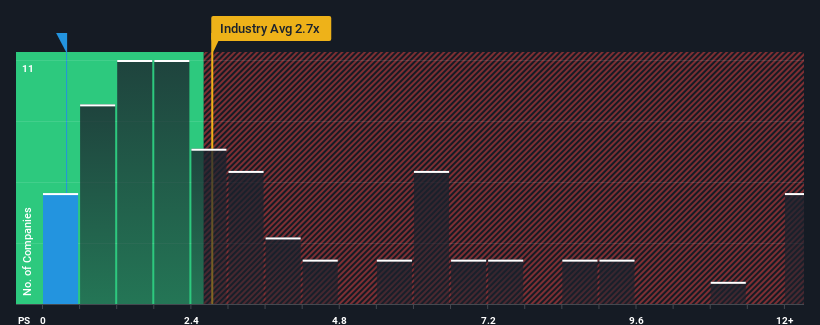
After such a large drop in price, Hylink Digital SolutionsLtd's price-to-sales (or "P/S") ratio of 0.4x might make it look like a strong buy right now compared to the wider Media industry in China, where around half of the companies have P/S ratios above 2.7x and even P/S above 7x are quite common. Nonetheless, we'd need to dig a little deeper to determine if there is a rational basis for the highly reduced P/S.
What Does Hylink Digital SolutionsLtd's P/S Mean For Shareholders?
For example, consider that Hylink Digital SolutionsLtd's financial performance has been poor lately as its revenue has been in decline. It might be that many expect the disappointing revenue performance to continue or accelerate, which has repressed the P/S. Those who are bullish on Hylink Digital SolutionsLtd will be hoping that this isn't the case so that they can pick up the stock at a lower valuation.
Although there are no analyst estimates available for Hylink Digital SolutionsLtd, take a look at this free data-rich visualisation to see how the company stacks up on earnings, revenue and cash flow.Is There Any Revenue Growth Forecasted For Hylink Digital SolutionsLtd?
Hylink Digital SolutionsLtd's P/S ratio would be typical for a company that's expected to deliver very poor growth or even falling revenue, and importantly, perform much worse than the industry.
In reviewing the last year of financials, we were disheartened to see the company's revenues fell to the tune of 34%. This means it has also seen a slide in revenue over the longer-term as revenue is down 29% in total over the last three years. So unfortunately, we have to acknowledge that the company has not done a great job of growing revenue over that time.
Weighing that medium-term revenue trajectory against the broader industry's one-year forecast for expansion of 20% shows it's an unpleasant look.
In light of this, it's understandable that Hylink Digital SolutionsLtd's P/S would sit below the majority of other companies. Nonetheless, there's no guarantee the P/S has reached a floor yet with revenue going in reverse. Even just maintaining these prices could be difficult to achieve as recent revenue trends are already weighing down the shares.
What We Can Learn From Hylink Digital SolutionsLtd's P/S?
Shares in Hylink Digital SolutionsLtd have plummeted and its P/S has followed suit. While the price-to-sales ratio shouldn't be the defining factor in whether you buy a stock or not, it's quite a capable barometer of revenue expectations.
Our examination of Hylink Digital SolutionsLtd confirms that the company's shrinking revenue over the past medium-term is a key factor in its low price-to-sales ratio, given the industry is projected to grow. At this stage investors feel the potential for an improvement in revenue isn't great enough to justify a higher P/S ratio. Given the current circumstances, it seems unlikely that the share price will experience any significant movement in either direction in the near future if recent medium-term revenue trends persist.
Having said that, be aware Hylink Digital SolutionsLtd is showing 2 warning signs in our investment analysis, you should know about.
If companies with solid past earnings growth is up your alley, you may wish to see this free collection of other companies with strong earnings growth and low P/E ratios.
Have feedback on this article? Concerned about the content? Get in touch with us directly. Alternatively, email editorial-team (at) simplywallst.com.
This article by Simply Wall St is general in nature. We provide commentary based on historical data and analyst forecasts only using an unbiased methodology and our articles are not intended to be financial advice. It does not constitute a recommendation to buy or sell any stock, and does not take account of your objectives, or your financial situation. We aim to bring you long-term focused analysis driven by fundamental data. Note that our analysis may not factor in the latest price-sensitive company announcements or qualitative material. Simply Wall St has no position in any stocks mentioned.