
Key Insights
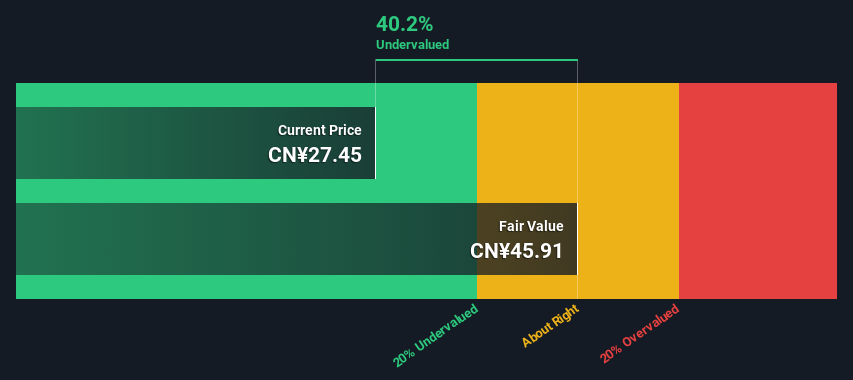
- Using the 2 Stage Free Cash Flow to Equity, Goodwill E-Health Info fair value estimate is CN¥45.91
- Current share price of CN¥27.45 suggests Goodwill E-Health Info is potentially 40% undervalued
- Analyst price target for 688246 is CN¥40.00 which is 13% below our fair value estimate
How far off is Goodwill E-Health Info Co., Ltd. (SHSE:688246) from its intrinsic value? Using the most recent financial data, we'll take a look at whether the stock is fairly priced by taking the expected future cash flows and discounting them to their present value. Our analysis will employ the Discounted Cash Flow (DCF) model. Models like these may appear beyond the comprehension of a lay person, but they're fairly easy to follow.
Companies can be valued in a lot of ways, so we would point out that a DCF is not perfect for every situation. Anyone interested in learning a bit more about intrinsic value should have a read of the Simply Wall St analysis model.
What's The Estimated Valuation?
We're using the 2-stage growth model, which simply means we take in account two stages of company's growth. In the initial period the company may have a higher growth rate and the second stage is usually assumed to have a stable growth rate. To start off with, we need to estimate the next ten years of cash flows. Where possible we use analyst estimates, but when these aren't available we extrapolate the previous free cash flow (FCF) from the last estimate or reported value. We assume companies with shrinking free cash flow will slow their rate of shrinkage, and that companies with growing free cash flow will see their growth rate slow, over this period. We do this to reflect that growth tends to slow more in the early years than it does in later years.
Generally we assume that a dollar today is more valuable than a dollar in the future, so we discount the value of these future cash flows to their estimated value in today's dollars:
10-year free cash flow (FCF) estimate
| 2024 | 2025 | 2026 | 2027 | 2028 | 2029 | 2030 | 2031 | 2032 | 2033 | |
| Levered FCF (CN¥, Millions) | -CN¥10.6m | -CN¥73.8m | CN¥35.6m | CN¥118.5m | CN¥212.9m | CN¥292.7m | CN¥372.0m | CN¥445.9m | CN¥511.9m | CN¥569.4m |
| Growth Rate Estimate Source | Analyst x1 | Analyst x1 | Analyst x1 | Analyst x1 | Analyst x1 | Est @ 37.48% | Est @ 27.12% | Est @ 19.86% | Est @ 14.79% | Est @ 11.23% |
| Present Value (CN¥, Millions) Discounted @ 8.2% | -CN¥9.8 | -CN¥63.0 | CN¥28.1 | CN¥86.4 | CN¥143 | CN¥182 | CN¥214 | CN¥237 | CN¥251 | CN¥258 |
("Est" = FCF growth rate estimated by Simply Wall St)
Present Value of 10-year Cash Flow (PVCF) = CN¥1.3b
After calculating the present value of future cash flows in the initial 10-year period, we need to calculate the Terminal Value, which accounts for all future cash flows beyond the first stage. The Gordon Growth formula is used to calculate Terminal Value at a future annual growth rate equal to the 5-year average of the 10-year government bond yield of 2.9%. We discount the terminal cash flows to today's value at a cost of equity of 8.2%.
Terminal Value (TV)= FCF2033 × (1 + g) ÷ (r – g) = CN¥569m× (1 + 2.9%) ÷ (8.2%– 2.9%) = CN¥11b
Present Value of Terminal Value (PVTV)= TV / (1 + r)10= CN¥11b÷ ( 1 + 8.2%)10= CN¥5.0b
The total value, or equity value, is then the sum of the present value of the future cash flows, which in this case is CN¥6.4b. In the final step we divide the equity value by the number of shares outstanding. Compared to the current share price of CN¥27.5, the company appears quite good value at a 40% discount to where the stock price trades currently. The assumptions in any calculation have a big impact on the valuation, so it is better to view this as a rough estimate, not precise down to the last cent.
The Assumptions
The calculation above is very dependent on two assumptions. The first is the discount rate and the other is the cash flows. If you don't agree with these result, have a go at the calculation yourself and play with the assumptions. The DCF also does not consider the possible cyclicality of an industry, or a company's future capital requirements, so it does not give a full picture of a company's potential performance. Given that we are looking at Goodwill E-Health Info as potential shareholders, the cost of equity is used as the discount rate, rather than the cost of capital (or weighted average cost of capital, WACC) which accounts for debt. In this calculation we've used 8.2%, which is based on a levered beta of 0.938. Beta is a measure of a stock's volatility, compared to the market as a whole. We get our beta from the industry average beta of globally comparable companies, with an imposed limit between 0.8 and 2.0, which is a reasonable range for a stable business.
SWOT Analysis for Goodwill E-Health Info
- Debt is well covered by earnings.
- Balance sheet summary for 688246.
- Earnings declined over the past year.
- Annual earnings are forecast to grow faster than the Chinese market.
- Trading below our estimate of fair value by more than 20%.
- Debt is not well covered by operating cash flow.
- Is 688246 well equipped to handle threats?
Looking Ahead:
Whilst important, the DCF calculation shouldn't be the only metric you look at when researching a company. It's not possible to obtain a foolproof valuation with a DCF model. Rather it should be seen as a guide to "what assumptions need to be true for this stock to be under/overvalued?" For instance, if the terminal value growth rate is adjusted slightly, it can dramatically alter the overall result. Why is the intrinsic value higher than the current share price? For Goodwill E-Health Info, we've compiled three essential aspects you should further research:
- Risks: Every company has them, and we've spotted 2 warning signs for Goodwill E-Health Info you should know about.
- Future Earnings: How does 688246's growth rate compare to its peers and the wider market? Dig deeper into the analyst consensus number for the upcoming years by interacting with our free analyst growth expectation chart.
- Other Solid Businesses: Low debt, high returns on equity and good past performance are fundamental to a strong business. Why not explore our interactive list of stocks with solid business fundamentals to see if there are other companies you may not have considered!
PS. Simply Wall St updates its DCF calculation for every Chinese stock every day, so if you want to find the intrinsic value of any other stock just search here.
Have feedback on this article? Concerned about the content? Get in touch with us directly. Alternatively, email editorial-team (at) simplywallst.com.
This article by Simply Wall St is general in nature. We provide commentary based on historical data and analyst forecasts only using an unbiased methodology and our articles are not intended to be financial advice. It does not constitute a recommendation to buy or sell any stock, and does not take account of your objectives, or your financial situation. We aim to bring you long-term focused analysis driven by fundamental data. Note that our analysis may not factor in the latest price-sensitive company announcements or qualitative material. Simply Wall St has no position in any stocks mentioned.