
It's been a soft week for Fujian Raynen Technology Co., Ltd. (SHSE:603933) shares, which are down 11%. But that shouldn't obscure the pleasing returns achieved by shareholders over the last three years. In the last three years the share price is up, 52%: better than the market.
While the stock has fallen 11% this week, it's worth focusing on the longer term and seeing if the stocks historical returns have been driven by the underlying fundamentals.
In his essay The Superinvestors of Graham-and-Doddsville Warren Buffett described how share prices do not always rationally reflect the value of a business. One imperfect but simple way to consider how the market perception of a company has shifted is to compare the change in the earnings per share (EPS) with the share price movement.
Fujian Raynen Technology was able to grow its EPS at 63% per year over three years, sending the share price higher. This EPS growth is higher than the 15% average annual increase in the share price. Therefore, it seems the market has moderated its expectations for growth, somewhat. Having said that, the market is still optimistic, given the P/E ratio of 62.62.
The company's earnings per share (over time) is depicted in the image below (click to see the exact numbers).
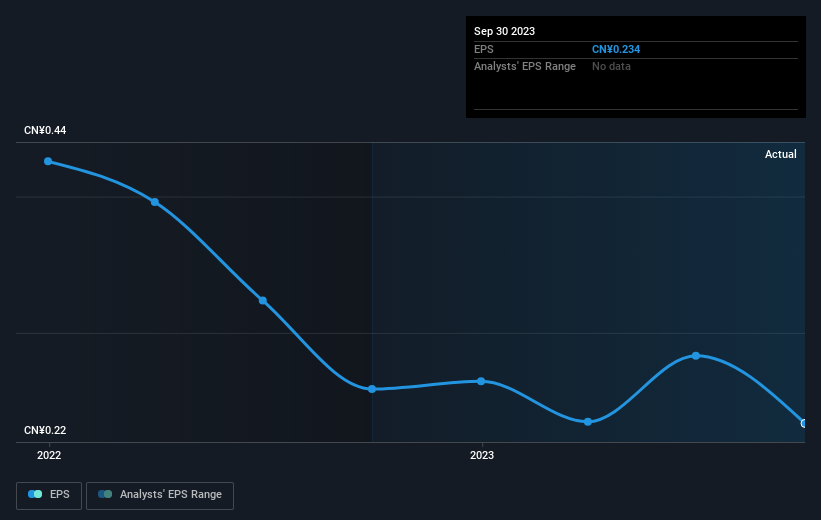
It's probably worth noting that the CEO is paid less than the median at similar sized companies. It's always worth keeping an eye on CEO pay, but a more important question is whether the company will grow earnings throughout the years. Before buying or selling a stock, we always recommend a close examination of historic growth trends, available here..
What About Dividends?
It is important to consider the total shareholder return, as well as the share price return, for any given stock. The TSR incorporates the value of any spin-offs or discounted capital raisings, along with any dividends, based on the assumption that the dividends are reinvested. Arguably, the TSR gives a more comprehensive picture of the return generated by a stock. We note that for Fujian Raynen Technology the TSR over the last 3 years was 55%, which is better than the share price return mentioned above. And there's no prize for guessing that the dividend payments largely explain the divergence!
A Different Perspective
We're pleased to report that Fujian Raynen Technology shareholders have received a total shareholder return of 15% over one year. Of course, that includes the dividend. There's no doubt those recent returns are much better than the TSR loss of 0.3% per year over five years. The long term loss makes us cautious, but the short term TSR gain certainly hints at a brighter future. While it is well worth considering the different impacts that market conditions can have on the share price, there are other factors that are even more important. Case in point: We've spotted 3 warning signs for Fujian Raynen Technology you should be aware of, and 2 of them don't sit too well with us.
We will like Fujian Raynen Technology better if we see some big insider buys. While we wait, check out this free list of growing companies with considerable, recent, insider buying.
Please note, the market returns quoted in this article reflect the market weighted average returns of stocks that currently trade on Chinese exchanges.
Have feedback on this article? Concerned about the content? Get in touch with us directly. Alternatively, email editorial-team (at) simplywallst.com.
This article by Simply Wall St is general in nature. We provide commentary based on historical data and analyst forecasts only using an unbiased methodology and our articles are not intended to be financial advice. It does not constitute a recommendation to buy or sell any stock, and does not take account of your objectives, or your financial situation. We aim to bring you long-term focused analysis driven by fundamental data. Note that our analysis may not factor in the latest price-sensitive company announcements or qualitative material. Simply Wall St has no position in any stocks mentioned.