
Zhejiang Xinan Chemical Industrial GroupLtd (SHSE:600596) has had a rough three months with its share price down 9.5%. However, stock prices are usually driven by a company's financials over the long term, which in this case look pretty respectable. Particularly, we will be paying attention to Zhejiang Xinan Chemical Industrial GroupLtd's ROE today.
Return on equity or ROE is an important factor to be considered by a shareholder because it tells them how effectively their capital is being reinvested. In short, ROE shows the profit each dollar generates with respect to its shareholder investments.
How Do You Calculate Return On Equity?
The formula for return on equity is:
Return on Equity = Net Profit (from continuing operations) ÷ Shareholders' Equity
So, based on the above formula, the ROE for Zhejiang Xinan Chemical Industrial GroupLtd is:
2.6% = CN¥311m ÷ CN¥12b (Based on the trailing twelve months to September 2023).
The 'return' is the profit over the last twelve months. That means that for every CN¥1 worth of shareholders' equity, the company generated CN¥0.03 in profit.
What Has ROE Got To Do With Earnings Growth?
So far, we've learned that ROE is a measure of a company's profitability. Based on how much of its profits the company chooses to reinvest or "retain", we are then able to evaluate a company's future ability to generate profits. Generally speaking, other things being equal, firms with a high return on equity and profit retention, have a higher growth rate than firms that don't share these attributes.
Zhejiang Xinan Chemical Industrial GroupLtd's Earnings Growth And 2.6% ROE
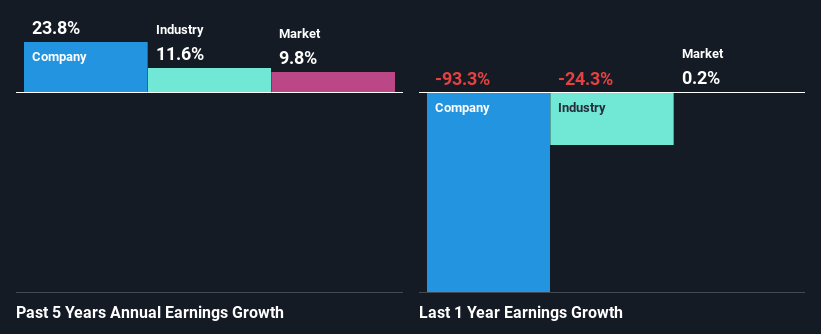
It is quite clear that Zhejiang Xinan Chemical Industrial GroupLtd's ROE is rather low. Even when compared to the industry average of 7.1%, the ROE figure is pretty disappointing. In spite of this, Zhejiang Xinan Chemical Industrial GroupLtd was able to grow its net income considerably, at a rate of 24% in the last five years. We reckon that there could be other factors at play here. Such as - high earnings retention or an efficient management in place.
Next, on comparing with the industry net income growth, we found that Zhejiang Xinan Chemical Industrial GroupLtd's growth is quite high when compared to the industry average growth of 12% in the same period, which is great to see.
Earnings growth is an important metric to consider when valuing a stock. It's important for an investor to know whether the market has priced in the company's expected earnings growth (or decline). By doing so, they will have an idea if the stock is headed into clear blue waters or if swampy waters await. If you're wondering about Zhejiang Xinan Chemical Industrial GroupLtd's's valuation, check out this gauge of its price-to-earnings ratio, as compared to its industry.
Is Zhejiang Xinan Chemical Industrial GroupLtd Making Efficient Use Of Its Profits?
Zhejiang Xinan Chemical Industrial GroupLtd's three-year median payout ratio to shareholders is 23%, which is quite low. This implies that the company is retaining 77% of its profits. This suggests that the management is reinvesting most of the profits to grow the business as evidenced by the growth seen by the company.
Besides, Zhejiang Xinan Chemical Industrial GroupLtd has been paying dividends for at least ten years or more. This shows that the company is committed to sharing profits with its shareholders.
Summary
Overall, we feel that Zhejiang Xinan Chemical Industrial GroupLtd certainly does have some positive factors to consider. Despite its low rate of return, the fact that the company reinvests a very high portion of its profits into its business, no doubt contributed to its high earnings growth. With that said, the latest industry analyst forecasts reveal that the company's earnings are expected to accelerate. To know more about the latest analysts predictions for the company, check out this visualization of analyst forecasts for the company.
Have feedback on this article? Concerned about the content? Get in touch with us directly. Alternatively, email editorial-team (at) simplywallst.com.
This article by Simply Wall St is general in nature. We provide commentary based on historical data and analyst forecasts only using an unbiased methodology and our articles are not intended to be financial advice. It does not constitute a recommendation to buy or sell any stock, and does not take account of your objectives, or your financial situation. We aim to bring you long-term focused analysis driven by fundamental data. Note that our analysis may not factor in the latest price-sensitive company announcements or qualitative material. Simply Wall St has no position in any stocks mentioned.