
Unfortunately for some shareholders, the FingerMotion, Inc. (NASDAQ:FNGR) share price has dived 28% in the last thirty days, prolonging recent pain. Looking at the bigger picture, even after this poor month the stock is up 47% in the last year.
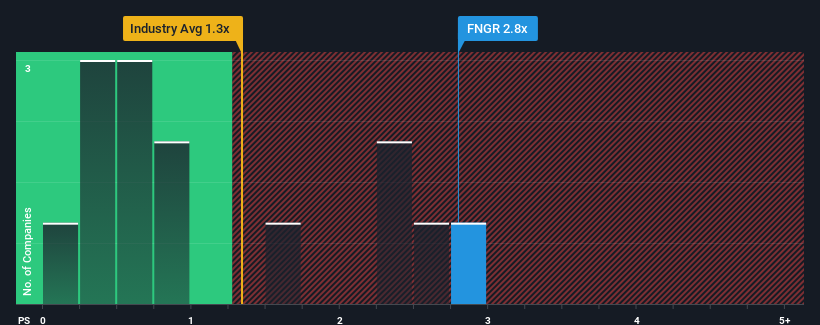
In spite of the heavy fall in price, when almost half of the companies in the United States' Wireless Telecom industry have price-to-sales ratios (or "P/S") below 0.6x, you may still consider FingerMotion as a stock not worth researching with its 2.8x P/S ratio. Although, it's not wise to just take the P/S at face value as there may be an explanation why it's so lofty.
How Has FingerMotion Performed Recently?
FingerMotion certainly has been doing a great job lately as it's been growing its revenue at a really rapid pace. Perhaps the market is expecting future revenue performance to outperform the wider market, which has seemingly got people interested in the stock. You'd really hope so, otherwise you're paying a pretty hefty price for no particular reason.
Although there are no analyst estimates available for FingerMotion, take a look at this free data-rich visualisation to see how the company stacks up on earnings, revenue and cash flow.Do Revenue Forecasts Match The High P/S Ratio?
The only time you'd be truly comfortable seeing a P/S as steep as FingerMotion's is when the company's growth is on track to outshine the industry decidedly.
Retrospectively, the last year delivered an exceptional 50% gain to the company's top line. The latest three year period has also seen an excellent 175% overall rise in revenue, aided by its short-term performance. So we can start by confirming that the company has done a great job of growing revenue over that time.
Comparing that to the industry, which is only predicted to deliver 2.8% growth in the next 12 months, the company's momentum is stronger based on recent medium-term annualised revenue results.
In light of this, it's understandable that FingerMotion's P/S sits above the majority of other companies. Presumably shareholders aren't keen to offload something they believe will continue to outmanoeuvre the wider industry.
What We Can Learn From FingerMotion's P/S?
Even after such a strong price drop, FingerMotion's P/S still exceeds the industry median significantly. Generally, our preference is to limit the use of the price-to-sales ratio to establishing what the market thinks about the overall health of a company.
We've established that FingerMotion maintains its high P/S on the strength of its recent three-year growth being higher than the wider industry forecast, as expected. Right now shareholders are comfortable with the P/S as they are quite confident revenue aren't under threat. Unless the recent medium-term conditions change, they will continue to provide strong support to the share price.
It is also worth noting that we have found 3 warning signs for FingerMotion (2 are significant!) that you need to take into consideration.
If these risks are making you reconsider your opinion on FingerMotion, explore our interactive list of high quality stocks to get an idea of what else is out there.
Have feedback on this article? Concerned about the content? Get in touch with us directly. Alternatively, email editorial-team (at) simplywallst.com.
This article by Simply Wall St is general in nature. We provide commentary based on historical data and analyst forecasts only using an unbiased methodology and our articles are not intended to be financial advice. It does not constitute a recommendation to buy or sell any stock, and does not take account of your objectives, or your financial situation. We aim to bring you long-term focused analysis driven by fundamental data. Note that our analysis may not factor in the latest price-sensitive company announcements or qualitative material. Simply Wall St has no position in any stocks mentioned.