
Nanning Department Store Co., Ltd. (SHSE:600712) shareholders are no doubt pleased to see that the share price has bounced 27% in the last month, although it is still struggling to make up recently lost ground. Unfortunately, despite the strong performance over the last month, the full year gain of 9.7% isn't as attractive.
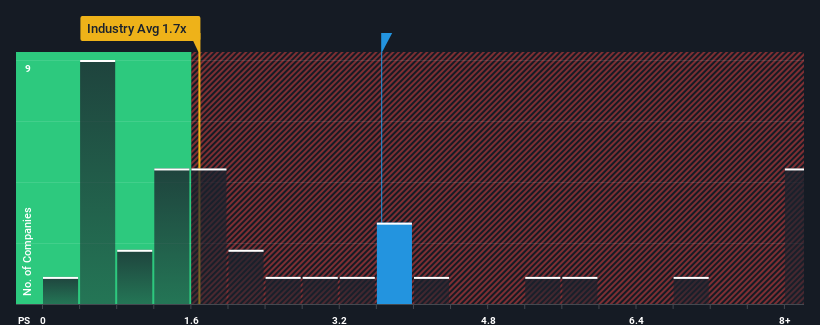
After such a large jump in price, you could be forgiven for thinking Nanning Department Store is a stock not worth researching with a price-to-sales ratios (or "P/S") of 3.6x, considering almost half the companies in China's Multiline Retail industry have P/S ratios below 1.7x. Nonetheless, we'd need to dig a little deeper to determine if there is a rational basis for the elevated P/S.
How Has Nanning Department Store Performed Recently?
For example, consider that Nanning Department Store's financial performance has been poor lately as its revenue has been in decline. One possibility is that the P/S is high because investors think the company will still do enough to outperform the broader industry in the near future. If not, then existing shareholders may be quite nervous about the viability of the share price.
We don't have analyst forecasts, but you can see how recent trends are setting up the company for the future by checking out our free report on Nanning Department Store's earnings, revenue and cash flow.What Are Revenue Growth Metrics Telling Us About The High P/S?
Nanning Department Store's P/S ratio would be typical for a company that's expected to deliver solid growth, and importantly, perform better than the industry.
In reviewing the last year of financials, we were disheartened to see the company's revenues fell to the tune of 8.2%. This means it has also seen a slide in revenue over the longer-term as revenue is down 38% in total over the last three years. Accordingly, shareholders would have felt downbeat about the medium-term rates of revenue growth.
Weighing that medium-term revenue trajectory against the broader industry's one-year forecast for expansion of 24% shows it's an unpleasant look.
With this in mind, we find it worrying that Nanning Department Store's P/S exceeds that of its industry peers. Apparently many investors in the company are way more bullish than recent times would indicate and aren't willing to let go of their stock at any price. There's a very good chance existing shareholders are setting themselves up for future disappointment if the P/S falls to levels more in line with the recent negative growth rates.
What Does Nanning Department Store's P/S Mean For Investors?
Nanning Department Store's P/S is on the rise since its shares have risen strongly. While the price-to-sales ratio shouldn't be the defining factor in whether you buy a stock or not, it's quite a capable barometer of revenue expectations.
Our examination of Nanning Department Store revealed its shrinking revenue over the medium-term isn't resulting in a P/S as low as we expected, given the industry is set to grow. Right now we aren't comfortable with the high P/S as this revenue performance is highly unlikely to support such positive sentiment for long. If recent medium-term revenue trends continue, it will place shareholders' investments at significant risk and potential investors in danger of paying an excessive premium.
You should always think about risks. Case in point, we've spotted 1 warning sign for Nanning Department Store you should be aware of.
If these risks are making you reconsider your opinion on Nanning Department Store, explore our interactive list of high quality stocks to get an idea of what else is out there.
Have feedback on this article? Concerned about the content? Get in touch with us directly. Alternatively, email editorial-team (at) simplywallst.com.
This article by Simply Wall St is general in nature. We provide commentary based on historical data and analyst forecasts only using an unbiased methodology and our articles are not intended to be financial advice. It does not constitute a recommendation to buy or sell any stock, and does not take account of your objectives, or your financial situation. We aim to bring you long-term focused analysis driven by fundamental data. Note that our analysis may not factor in the latest price-sensitive company announcements or qualitative material. Simply Wall St has no position in any stocks mentioned.