
Yibin Paper Industry Co., Ltd. (SHSE:600793) shareholders are no doubt pleased to see that the share price has bounced 27% in the last month, although it is still struggling to make up recently lost ground. Not all shareholders will be feeling jubilant, since the share price is still down a very disappointing 17% in the last twelve months.
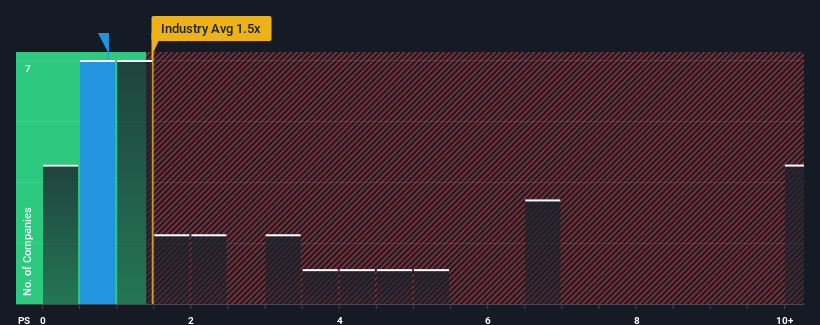
Even after such a large jump in price, Yibin Paper Industry's price-to-sales (or "P/S") ratio of 0.9x might still make it look like a buy right now compared to the Forestry industry in China, where around half of the companies have P/S ratios above 1.5x and even P/S above 5x are quite common. However, the P/S might be low for a reason and it requires further investigation to determine if it's justified.
What Does Yibin Paper Industry's Recent Performance Look Like?
For instance, Yibin Paper Industry's receding revenue in recent times would have to be some food for thought. Perhaps the market believes the recent revenue performance isn't good enough to keep up the industry, causing the P/S ratio to suffer. If you like the company, you'd be hoping this isn't the case so that you could potentially pick up some stock while it's out of favour.
Although there are no analyst estimates available for Yibin Paper Industry, take a look at this free data-rich visualisation to see how the company stacks up on earnings, revenue and cash flow.What Are Revenue Growth Metrics Telling Us About The Low P/S?
The only time you'd be truly comfortable seeing a P/S as low as Yibin Paper Industry's is when the company's growth is on track to lag the industry.
Retrospectively, the last year delivered a frustrating 4.3% decrease to the company's top line. Still, the latest three year period has seen an excellent 47% overall rise in revenue, in spite of its unsatisfying short-term performance. Accordingly, while they would have preferred to keep the run going, shareholders would definitely welcome the medium-term rates of revenue growth.
Comparing that to the industry, which is predicted to deliver 14% growth in the next 12 months, the company's momentum is pretty similar based on recent medium-term annualised revenue results.
With this in consideration, we find it intriguing that Yibin Paper Industry's P/S falls short of its industry peers. Apparently some shareholders are more bearish than recent times would indicate and have been accepting lower selling prices.
The Final Word
The latest share price surge wasn't enough to lift Yibin Paper Industry's P/S close to the industry median. It's argued the price-to-sales ratio is an inferior measure of value within certain industries, but it can be a powerful business sentiment indicator.
The fact that Yibin Paper Industry currently trades at a low P/S relative to the industry is unexpected considering its recent three-year growth is in line with the wider industry forecast. There could be some unobserved threats to revenue preventing the P/S ratio from matching the company's performance. medium-term
Before you settle on your opinion, we've discovered 2 warning signs for Yibin Paper Industry that you should be aware of.
If companies with solid past earnings growth is up your alley, you may wish to see this free collection of other companies with strong earnings growth and low P/E ratios.
Have feedback on this article? Concerned about the content? Get in touch with us directly. Alternatively, email editorial-team (at) simplywallst.com.
This article by Simply Wall St is general in nature. We provide commentary based on historical data and analyst forecasts only using an unbiased methodology and our articles are not intended to be financial advice. It does not constitute a recommendation to buy or sell any stock, and does not take account of your objectives, or your financial situation. We aim to bring you long-term focused analysis driven by fundamental data. Note that our analysis may not factor in the latest price-sensitive company announcements or qualitative material. Simply Wall St has no position in any stocks mentioned.