
Those holding Xinjiang Youhao(Group)Co.,Ltd (SHSE:600778) shares would be relieved that the share price has rebounded 28% in the last thirty days, but it needs to keep going to repair the recent damage it has caused to investor portfolios. Not all shareholders will be feeling jubilant, since the share price is still down a very disappointing 28% in the last twelve months.
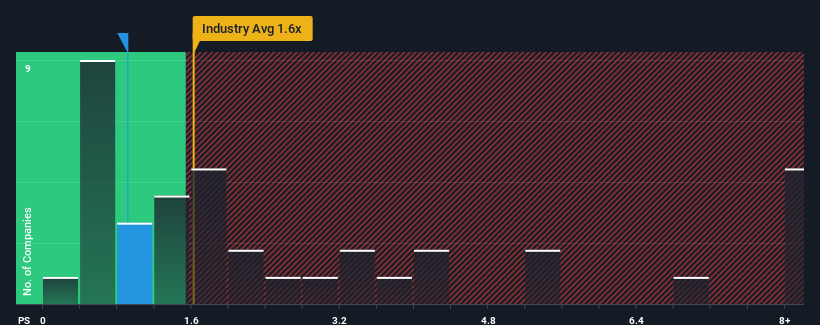
Although its price has surged higher, Xinjiang Youhao(Group)Co.Ltd may still be sending bullish signals at the moment with its price-to-sales (or "P/S") ratio of 0.9x, since almost half of all companies in the Multiline Retail industry in China have P/S ratios greater than 1.6x and even P/S higher than 4x are not unusual. However, the P/S might be low for a reason and it requires further investigation to determine if it's justified.
What Does Xinjiang Youhao(Group)Co.Ltd's P/S Mean For Shareholders?
For instance, Xinjiang Youhao(Group)Co.Ltd's receding revenue in recent times would have to be some food for thought. It might be that many expect the disappointing revenue performance to continue or accelerate, which has repressed the P/S. Those who are bullish on Xinjiang Youhao(Group)Co.Ltd will be hoping that this isn't the case so that they can pick up the stock at a lower valuation.
Want the full picture on earnings, revenue and cash flow for the company? Then our free report on Xinjiang Youhao(Group)Co.Ltd will help you shine a light on its historical performance.How Is Xinjiang Youhao(Group)Co.Ltd's Revenue Growth Trending?
Xinjiang Youhao(Group)Co.Ltd's P/S ratio would be typical for a company that's only expected to deliver limited growth, and importantly, perform worse than the industry.
Taking a look back first, the company's revenue growth last year wasn't something to get excited about as it posted a disappointing decline of 8.1%. The last three years don't look nice either as the company has shrunk revenue by 45% in aggregate. Therefore, it's fair to say the revenue growth recently has been undesirable for the company.
Comparing that to the industry, which is predicted to deliver 24% growth in the next 12 months, the company's downward momentum based on recent medium-term revenue results is a sobering picture.
With this information, we are not surprised that Xinjiang Youhao(Group)Co.Ltd is trading at a P/S lower than the industry. Nonetheless, there's no guarantee the P/S has reached a floor yet with revenue going in reverse. Even just maintaining these prices could be difficult to achieve as recent revenue trends are already weighing down the shares.
The Bottom Line On Xinjiang Youhao(Group)Co.Ltd's P/S
The latest share price surge wasn't enough to lift Xinjiang Youhao(Group)Co.Ltd's P/S close to the industry median. Typically, we'd caution against reading too much into price-to-sales ratios when settling on investment decisions, though it can reveal plenty about what other market participants think about the company.
As we suspected, our examination of Xinjiang Youhao(Group)Co.Ltd revealed its shrinking revenue over the medium-term is contributing to its low P/S, given the industry is set to grow. Right now shareholders are accepting the low P/S as they concede future revenue probably won't provide any pleasant surprises either. Unless the recent medium-term conditions improve, they will continue to form a barrier for the share price around these levels.
It is also worth noting that we have found 1 warning sign for Xinjiang Youhao(Group)Co.Ltd that you need to take into consideration.
If companies with solid past earnings growth is up your alley, you may wish to see this free collection of other companies with strong earnings growth and low P/E ratios.
Have feedback on this article? Concerned about the content? Get in touch with us directly. Alternatively, email editorial-team (at) simplywallst.com.
This article by Simply Wall St is general in nature. We provide commentary based on historical data and analyst forecasts only using an unbiased methodology and our articles are not intended to be financial advice. It does not constitute a recommendation to buy or sell any stock, and does not take account of your objectives, or your financial situation. We aim to bring you long-term focused analysis driven by fundamental data. Note that our analysis may not factor in the latest price-sensitive company announcements or qualitative material. Simply Wall St has no position in any stocks mentioned.