
Nanya New Material Technology Co.,Ltd (SHSE:688519) shareholders are no doubt pleased to see that the share price has bounced 53% in the last month, although it is still struggling to make up recently lost ground. Not all shareholders will be feeling jubilant, since the share price is still down a very disappointing 17% in the last twelve months.
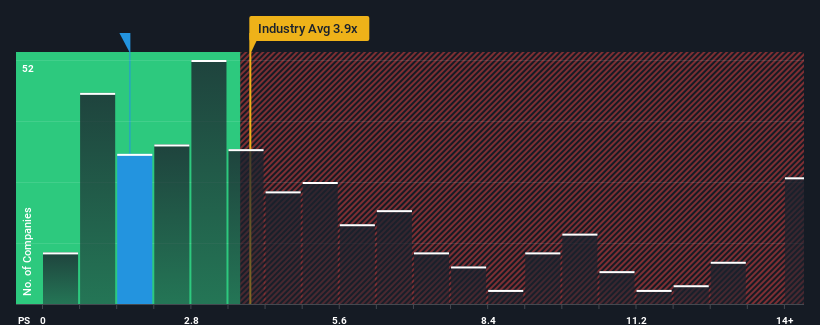
In spite of the firm bounce in price, Nanya New Material TechnologyLtd's price-to-sales (or "P/S") ratio of 1.6x might still make it look like a strong buy right now compared to the wider Electronic industry in China, where around half of the companies have P/S ratios above 3.9x and even P/S above 7x are quite common. Although, it's not wise to just take the P/S at face value as there may be an explanation why it's so limited.
What Does Nanya New Material TechnologyLtd's P/S Mean For Shareholders?
For example, consider that Nanya New Material TechnologyLtd's financial performance has been poor lately as its revenue has been in decline. One possibility is that the P/S is low because investors think the company won't do enough to avoid underperforming the broader industry in the near future. If you like the company, you'd be hoping this isn't the case so that you could potentially pick up some stock while it's out of favour.
Although there are no analyst estimates available for Nanya New Material TechnologyLtd, take a look at this free data-rich visualisation to see how the company stacks up on earnings, revenue and cash flow.Do Revenue Forecasts Match The Low P/S Ratio?
In order to justify its P/S ratio, Nanya New Material TechnologyLtd would need to produce anemic growth that's substantially trailing the industry.
In reviewing the last year of financials, we were disheartened to see the company's revenues fell to the tune of 21%. However, a few very strong years before that means that it was still able to grow revenue by an impressive 41% in total over the last three years. So we can start by confirming that the company has generally done a very good job of growing revenue over that time, even though it had some hiccups along the way.
Comparing that to the industry, which is predicted to deliver 25% growth in the next 12 months, the company's momentum is weaker, based on recent medium-term annualised revenue results.
With this information, we can see why Nanya New Material TechnologyLtd is trading at a P/S lower than the industry. Apparently many shareholders weren't comfortable holding on to something they believe will continue to trail the wider industry.
What Does Nanya New Material TechnologyLtd's P/S Mean For Investors?
Nanya New Material TechnologyLtd's recent share price jump still sees fails to bring its P/S alongside the industry median. It's argued the price-to-sales ratio is an inferior measure of value within certain industries, but it can be a powerful business sentiment indicator.
In line with expectations, Nanya New Material TechnologyLtd maintains its low P/S on the weakness of its recent three-year growth being lower than the wider industry forecast. Right now shareholders are accepting the low P/S as they concede future revenue probably won't provide any pleasant surprises. Unless the recent medium-term conditions improve, they will continue to form a barrier for the share price around these levels.
There are also other vital risk factors to consider and we've discovered 4 warning signs for Nanya New Material TechnologyLtd (2 are significant!) that you should be aware of before investing here.
Of course, profitable companies with a history of great earnings growth are generally safer bets. So you may wish to see this free collection of other companies that have reasonable P/E ratios and have grown earnings strongly.
Have feedback on this article? Concerned about the content? Get in touch with us directly. Alternatively, email editorial-team (at) simplywallst.com.
This article by Simply Wall St is general in nature. We provide commentary based on historical data and analyst forecasts only using an unbiased methodology and our articles are not intended to be financial advice. It does not constitute a recommendation to buy or sell any stock, and does not take account of your objectives, or your financial situation. We aim to bring you long-term focused analysis driven by fundamental data. Note that our analysis may not factor in the latest price-sensitive company announcements or qualitative material. Simply Wall St has no position in any stocks mentioned.