
ROPEOK Technology Group Co., Ltd. (SHSE:688619) shareholders are no doubt pleased to see that the share price has bounced 34% in the last month, although it is still struggling to make up recently lost ground. Still, the 30-day jump doesn't change the fact that longer term shareholders have seen their stock decimated by the 52% share price drop in the last twelve months.
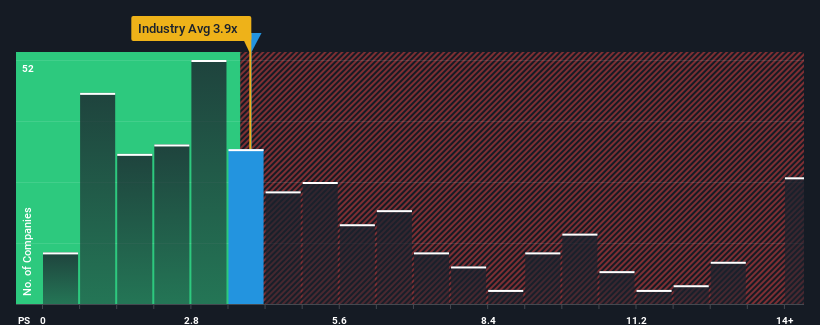
In spite of the firm bounce in price, you could still be forgiven for feeling indifferent about ROPEOK Technology Group's P/S ratio of 3.9x, since the median price-to-sales (or "P/S") ratio for the Electronic industry in China is about the same. However, investors might be overlooking a clear opportunity or potential setback if there is no rational basis for the P/S.
What Does ROPEOK Technology Group's Recent Performance Look Like?
With revenue growth that's exceedingly strong of late, ROPEOK Technology Group has been doing very well. The P/S is probably moderate because investors think this strong revenue growth might not be enough to outperform the broader industry in the near future. Those who are bullish on ROPEOK Technology Group will be hoping that this isn't the case, so that they can pick up the stock at a lower valuation.
Want the full picture on earnings, revenue and cash flow for the company? Then our free report on ROPEOK Technology Group will help you shine a light on its historical performance.How Is ROPEOK Technology Group's Revenue Growth Trending?
There's an inherent assumption that a company should be matching the industry for P/S ratios like ROPEOK Technology Group's to be considered reasonable.
If we review the last year of revenue growth, the company posted a terrific increase of 165%. Revenue has also lifted 11% in aggregate from three years ago, mostly thanks to the last 12 months of growth. Therefore, it's fair to say the revenue growth recently has been respectable for the company.
This is in contrast to the rest of the industry, which is expected to grow by 25% over the next year, materially higher than the company's recent medium-term annualised growth rates.
With this in mind, we find it intriguing that ROPEOK Technology Group's P/S is comparable to that of its industry peers. Apparently many investors in the company are less bearish than recent times would indicate and aren't willing to let go of their stock right now. They may be setting themselves up for future disappointment if the P/S falls to levels more in line with recent growth rates.
The Final Word
ROPEOK Technology Group appears to be back in favour with a solid price jump bringing its P/S back in line with other companies in the industry It's argued the price-to-sales ratio is an inferior measure of value within certain industries, but it can be a powerful business sentiment indicator.
Our examination of ROPEOK Technology Group revealed its poor three-year revenue trends aren't resulting in a lower P/S as per our expectations, given they look worse than current industry outlook. When we see weak revenue with slower than industry growth, we suspect the share price is at risk of declining, bringing the P/S back in line with expectations. If recent medium-term revenue trends continue, the probability of a share price decline will become quite substantial, placing shareholders at risk.
And what about other risks? Every company has them, and we've spotted 2 warning signs for ROPEOK Technology Group you should know about.
It's important to make sure you look for a great company, not just the first idea you come across. So if growing profitability aligns with your idea of a great company, take a peek at this free list of interesting companies with strong recent earnings growth (and a low P/E).
Have feedback on this article? Concerned about the content? Get in touch with us directly. Alternatively, email editorial-team (at) simplywallst.com.
This article by Simply Wall St is general in nature. We provide commentary based on historical data and analyst forecasts only using an unbiased methodology and our articles are not intended to be financial advice. It does not constitute a recommendation to buy or sell any stock, and does not take account of your objectives, or your financial situation. We aim to bring you long-term focused analysis driven by fundamental data. Note that our analysis may not factor in the latest price-sensitive company announcements or qualitative material. Simply Wall St has no position in any stocks mentioned.