
Inmyshow Digital Technology(Group)Co.,Ltd. (SHSE:600556) shareholders are no doubt pleased to see that the share price has bounced 30% in the last month, although it is still struggling to make up recently lost ground. Unfortunately, the gains of the last month did little to right the losses of the last year with the stock still down 38% over that time.
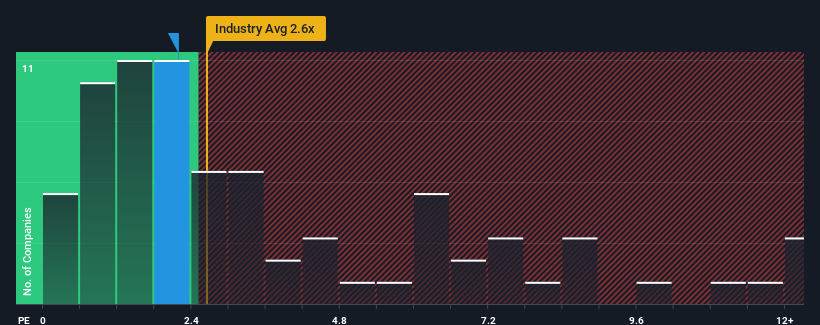
Even after such a large jump in price, you could still be forgiven for feeling indifferent about Inmyshow Digital Technology(Group)Co.Ltd's P/S ratio of 2.2x, since the median price-to-sales (or "P/S") ratio for the Media industry in China is also close to 2.6x. However, investors might be overlooking a clear opportunity or potential setback if there is no rational basis for the P/S.
What Does Inmyshow Digital Technology(Group)Co.Ltd's P/S Mean For Shareholders?
Inmyshow Digital Technology(Group)Co.Ltd could be doing better as its revenue has been going backwards lately while most other companies have been seeing positive revenue growth. Perhaps the market is expecting its poor revenue performance to improve, keeping the P/S from dropping. If not, then existing shareholders may be a little nervous about the viability of the share price.
Keen to find out how analysts think Inmyshow Digital Technology(Group)Co.Ltd's future stacks up against the industry? In that case, our free report is a great place to start.Do Revenue Forecasts Match The P/S Ratio?
In order to justify its P/S ratio, Inmyshow Digital Technology(Group)Co.Ltd would need to produce growth that's similar to the industry.
Taking a look back first, the company's revenue growth last year wasn't something to get excited about as it posted a disappointing decline of 4.0%. Still, the latest three year period has seen an excellent 48% overall rise in revenue, in spite of its unsatisfying short-term performance. Although it's been a bumpy ride, it's still fair to say the revenue growth recently has been more than adequate for the company.
Turning to the outlook, the next year should generate growth of 19% as estimated by the three analysts watching the company. Meanwhile, the rest of the industry is forecast to expand by 20%, which is not materially different.
With this in mind, it makes sense that Inmyshow Digital Technology(Group)Co.Ltd's P/S is closely matching its industry peers. Apparently shareholders are comfortable to simply hold on while the company is keeping a low profile.
The Bottom Line On Inmyshow Digital Technology(Group)Co.Ltd's P/S
Its shares have lifted substantially and now Inmyshow Digital Technology(Group)Co.Ltd's P/S is back within range of the industry median. Generally, our preference is to limit the use of the price-to-sales ratio to establishing what the market thinks about the overall health of a company.
A Inmyshow Digital Technology(Group)Co.Ltd's P/S seems about right to us given the knowledge that analysts are forecasting a revenue outlook that is similar to the Media industry. Right now shareholders are comfortable with the P/S as they are quite confident future revenue won't throw up any surprises. All things considered, if the P/S and revenue estimates contain no major shocks, then it's hard to see the share price moving strongly in either direction in the near future.
You should always think about risks. Case in point, we've spotted 2 warning signs for Inmyshow Digital Technology(Group)Co.Ltd you should be aware of.
It's important to make sure you look for a great company, not just the first idea you come across. So if growing profitability aligns with your idea of a great company, take a peek at this free list of interesting companies with strong recent earnings growth (and a low P/E).
Have feedback on this article? Concerned about the content? Get in touch with us directly. Alternatively, email editorial-team (at) simplywallst.com.
This article by Simply Wall St is general in nature. We provide commentary based on historical data and analyst forecasts only using an unbiased methodology and our articles are not intended to be financial advice. It does not constitute a recommendation to buy or sell any stock, and does not take account of your objectives, or your financial situation. We aim to bring you long-term focused analysis driven by fundamental data. Note that our analysis may not factor in the latest price-sensitive company announcements or qualitative material. Simply Wall St has no position in any stocks mentioned.