
Those holding Shenzhen Neoway Technology Co.,Ltd. (SHSE:688159) shares would be relieved that the share price has rebounded 30% in the last thirty days, but it needs to keep going to repair the recent damage it has caused to investor portfolios. Looking back a bit further, it's encouraging to see the stock is up 85% in the last year.
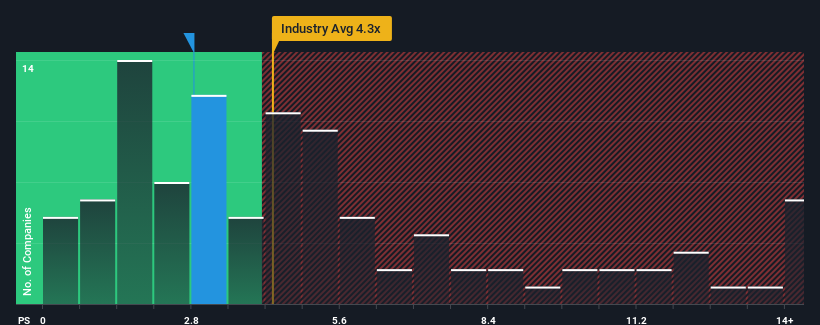
In spite of the firm bounce in price, Shenzhen Neoway TechnologyLtd may still be sending bullish signals at the moment with its price-to-sales (or "P/S") ratio of 2.8x, since almost half of all companies in the Communications industry in China have P/S ratios greater than 4.3x and even P/S higher than 8x are not unusual. Although, it's not wise to just take the P/S at face value as there may be an explanation why it's limited.
What Does Shenzhen Neoway TechnologyLtd's P/S Mean For Shareholders?
Recent times have been quite advantageous for Shenzhen Neoway TechnologyLtd as its revenue has been rising very briskly. Perhaps the market is expecting future revenue performance to dwindle, which has kept the P/S suppressed. If you like the company, you'd be hoping this isn't the case so that you could potentially pick up some stock while it's out of favour.
Although there are no analyst estimates available for Shenzhen Neoway TechnologyLtd, take a look at this free data-rich visualisation to see how the company stacks up on earnings, revenue and cash flow.Is There Any Revenue Growth Forecasted For Shenzhen Neoway TechnologyLtd?
Shenzhen Neoway TechnologyLtd's P/S ratio would be typical for a company that's only expected to deliver limited growth, and importantly, perform worse than the industry.
Retrospectively, the last year delivered an exceptional 51% gain to the company's top line. Pleasingly, revenue has also lifted 121% in aggregate from three years ago, thanks to the last 12 months of growth. Accordingly, shareholders would have definitely welcomed those medium-term rates of revenue growth.
Comparing the recent medium-term revenue trends against the industry's one-year growth forecast of 52% shows it's noticeably less attractive.
With this information, we can see why Shenzhen Neoway TechnologyLtd is trading at a P/S lower than the industry. Apparently many shareholders weren't comfortable holding on to something they believe will continue to trail the wider industry.
The Final Word
The latest share price surge wasn't enough to lift Shenzhen Neoway TechnologyLtd's P/S close to the industry median. We'd say the price-to-sales ratio's power isn't primarily as a valuation instrument but rather to gauge current investor sentiment and future expectations.
In line with expectations, Shenzhen Neoway TechnologyLtd maintains its low P/S on the weakness of its recent three-year growth being lower than the wider industry forecast. Right now shareholders are accepting the low P/S as they concede future revenue probably won't provide any pleasant surprises. If recent medium-term revenue trends continue, it's hard to see the share price experience a reversal of fortunes anytime soon.
You always need to take note of risks, for example - Shenzhen Neoway TechnologyLtd has 1 warning sign we think you should be aware of.
Of course, profitable companies with a history of great earnings growth are generally safer bets. So you may wish to see this free collection of other companies that have reasonable P/E ratios and have grown earnings strongly.
Have feedback on this article? Concerned about the content? Get in touch with us directly. Alternatively, email editorial-team (at) simplywallst.com.
This article by Simply Wall St is general in nature. We provide commentary based on historical data and analyst forecasts only using an unbiased methodology and our articles are not intended to be financial advice. It does not constitute a recommendation to buy or sell any stock, and does not take account of your objectives, or your financial situation. We aim to bring you long-term focused analysis driven by fundamental data. Note that our analysis may not factor in the latest price-sensitive company announcements or qualitative material. Simply Wall St has no position in any stocks mentioned.