
Nanjing Medlander Medical Technology Co.,Ltd. (SHSE:688273) shareholders are no doubt pleased to see that the share price has bounced 29% in the last month, although it is still struggling to make up recently lost ground. Unfortunately, the gains of the last month did little to right the losses of the last year with the stock still down 42% over that time.
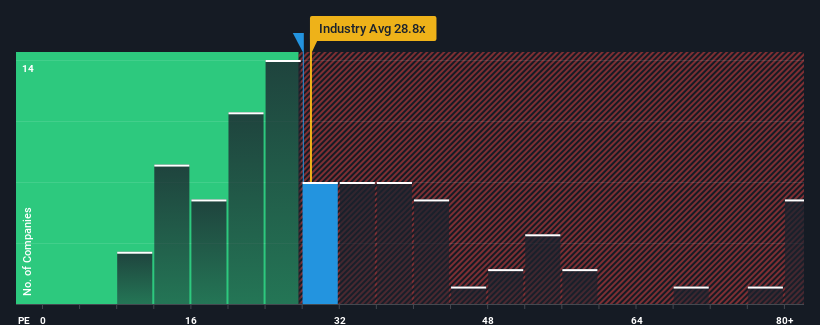
Even after such a large jump in price, there still wouldn't be many who think Nanjing Medlander Medical TechnologyLtd's price-to-earnings (or "P/E") ratio of 28x is worth a mention when the median P/E in China is similar at about 30x. While this might not raise any eyebrows, if the P/E ratio is not justified investors could be missing out on a potential opportunity or ignoring looming disappointment.
Recent times haven't been advantageous for Nanjing Medlander Medical TechnologyLtd as its earnings have been falling quicker than most other companies. One possibility is that the P/E is moderate because investors think the company's earnings trend will eventually fall in line with most others in the market. You'd much rather the company wasn't bleeding earnings if you still believe in the business. Or at the very least, you'd be hoping it doesn't keep underperforming if your plan is to pick up some stock while it's not in favour.
How Is Nanjing Medlander Medical TechnologyLtd's Growth Trending?
The only time you'd be comfortable seeing a P/E like Nanjing Medlander Medical TechnologyLtd's is when the company's growth is tracking the market closely.
If we review the last year of earnings, dishearteningly the company's profits fell to the tune of 40%. This means it has also seen a slide in earnings over the longer-term as EPS is down 46% in total over the last three years. Therefore, it's fair to say the earnings growth recently has been undesirable for the company.
Shifting to the future, estimates from the one analyst covering the company suggest earnings should grow by 90% over the next year. Meanwhile, the rest of the market is forecast to only expand by 41%, which is noticeably less attractive.
With this information, we find it interesting that Nanjing Medlander Medical TechnologyLtd is trading at a fairly similar P/E to the market. Apparently some shareholders are skeptical of the forecasts and have been accepting lower selling prices.
The Bottom Line On Nanjing Medlander Medical TechnologyLtd's P/E
Its shares have lifted substantially and now Nanjing Medlander Medical TechnologyLtd's P/E is also back up to the market median. Using the price-to-earnings ratio alone to determine if you should sell your stock isn't sensible, however it can be a practical guide to the company's future prospects.
Our examination of Nanjing Medlander Medical TechnologyLtd's analyst forecasts revealed that its superior earnings outlook isn't contributing to its P/E as much as we would have predicted. When we see a strong earnings outlook with faster-than-market growth, we assume potential risks are what might be placing pressure on the P/E ratio. It appears some are indeed anticipating earnings instability, because these conditions should normally provide a boost to the share price.
Having said that, be aware Nanjing Medlander Medical TechnologyLtd is showing 1 warning sign in our investment analysis, you should know about.
Of course, you might find a fantastic investment by looking at a few good candidates. So take a peek at this free list of companies with a strong growth track record, trading on a low P/E.
Have feedback on this article? Concerned about the content? Get in touch with us directly. Alternatively, email editorial-team (at) simplywallst.com.
This article by Simply Wall St is general in nature. We provide commentary based on historical data and analyst forecasts only using an unbiased methodology and our articles are not intended to be financial advice. It does not constitute a recommendation to buy or sell any stock, and does not take account of your objectives, or your financial situation. We aim to bring you long-term focused analysis driven by fundamental data. Note that our analysis may not factor in the latest price-sensitive company announcements or qualitative material. Simply Wall St has no position in any stocks mentioned.