
Shenzhen Injoinic Technology Co.,Ltd. (SHSE:688209) shareholders are no doubt pleased to see that the share price has bounced 29% in the last month, although it is still struggling to make up recently lost ground. Not all shareholders will be feeling jubilant, since the share price is still down a very disappointing 31% in the last twelve months.
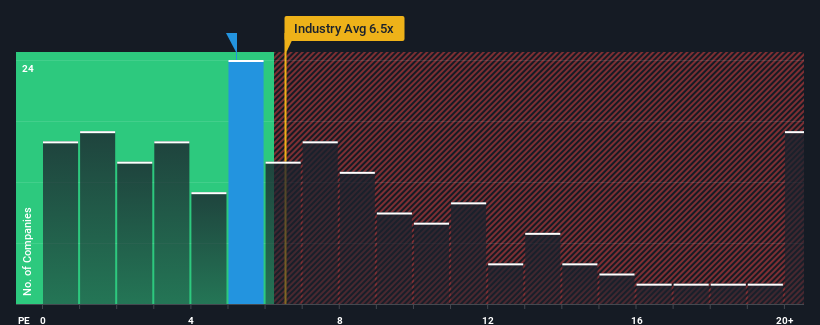
In spite of the firm bounce in price, Shenzhen Injoinic TechnologyLtd may still be sending buy signals at present with its price-to-sales (or "P/S") ratio of 5.2x, considering almost half of all companies in the Semiconductor industry in China have P/S ratios greater than 6.5x and even P/S higher than 12x aren't out of the ordinary. Although, it's not wise to just take the P/S at face value as there may be an explanation why it's limited.
How Shenzhen Injoinic TechnologyLtd Has Been Performing
With revenue growth that's exceedingly strong of late, Shenzhen Injoinic TechnologyLtd has been doing very well. One possibility is that the P/S ratio is low because investors think this strong revenue growth might actually underperform the broader industry in the near future. If you like the company, you'd be hoping this isn't the case so that you could potentially pick up some stock while it's out of favour.
Although there are no analyst estimates available for Shenzhen Injoinic TechnologyLtd, take a look at this free data-rich visualisation to see how the company stacks up on earnings, revenue and cash flow.How Is Shenzhen Injoinic TechnologyLtd's Revenue Growth Trending?
There's an inherent assumption that a company should underperform the industry for P/S ratios like Shenzhen Injoinic TechnologyLtd's to be considered reasonable.
If we review the last year of revenue growth, the company posted a terrific increase of 40%. The latest three year period has also seen an excellent 213% overall rise in revenue, aided by its short-term performance. Accordingly, shareholders would have definitely welcomed those medium-term rates of revenue growth.
Comparing that to the industry, which is only predicted to deliver 37% growth in the next 12 months, the company's momentum is stronger based on recent medium-term annualised revenue results.
With this information, we find it odd that Shenzhen Injoinic TechnologyLtd is trading at a P/S lower than the industry. Apparently some shareholders believe the recent performance has exceeded its limits and have been accepting significantly lower selling prices.
The Final Word
Despite Shenzhen Injoinic TechnologyLtd's share price climbing recently, its P/S still lags most other companies. We'd say the price-to-sales ratio's power isn't primarily as a valuation instrument but rather to gauge current investor sentiment and future expectations.
We're very surprised to see Shenzhen Injoinic TechnologyLtd currently trading on a much lower than expected P/S since its recent three-year growth is higher than the wider industry forecast. Potential investors that are sceptical over continued revenue performance may be preventing the P/S ratio from matching previous strong performance. At least price risks look to be very low if recent medium-term revenue trends continue, but investors seem to think future revenue could see a lot of volatility.
It's always necessary to consider the ever-present spectre of investment risk. We've identified 2 warning signs with Shenzhen Injoinic TechnologyLtd (at least 1 which can't be ignored), and understanding these should be part of your investment process.
If you're unsure about the strength of Shenzhen Injoinic TechnologyLtd's business, why not explore our interactive list of stocks with solid business fundamentals for some other companies you may have missed.
Have feedback on this article? Concerned about the content? Get in touch with us directly. Alternatively, email editorial-team (at) simplywallst.com.
This article by Simply Wall St is general in nature. We provide commentary based on historical data and analyst forecasts only using an unbiased methodology and our articles are not intended to be financial advice. It does not constitute a recommendation to buy or sell any stock, and does not take account of your objectives, or your financial situation. We aim to bring you long-term focused analysis driven by fundamental data. Note that our analysis may not factor in the latest price-sensitive company announcements or qualitative material. Simply Wall St has no position in any stocks mentioned.