
 Yahoo Finance
 DUG Technology (ASX:DUG) Is Very Good At Capital Allocation
If you're not sure where to start when looking for the next multi-bagger, there are a few key trends you should keep an eye out for. Amongst other things, we'll want to see two things; firstly, a growing return on capital employed (ROCE) and secondly, an expansion in the company's amount of capital employed. This shows us that it's a compounding machine, able to continually reinvest its earnings back into the business and generate higher returns. Speaking of which, we noticed some great changes in DUG Technology's (ASX:DUG) returns on capital, so let's have a look.
Understanding Return On Capital Employed (ROCE)
If you haven't worked with ROCE before, it measures the 'return' (pre-tax profit) a company generates from capital employed in its business. The formula for this calculation on DUG Technology is:
Return on Capital Employed = Earnings Before Interest and Tax (EBIT) ÷ (Total Assets - Current Liabilities)
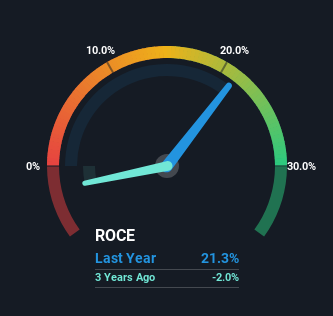
0.21 = US$9.0m ÷ (US$67m - US$25m) (Based on the trailing twelve months to December 2023).
So, DUG Technology has an ROCE of 21%. That's a fantastic return and not only that, it outpaces the average of 13% earned by companies in a similar industry.
View our latest analysis for DUG Technology
In the above chart we have measured DUG Technology's prior ROCE against its prior performance, but the future is arguably more important. If you'd like, you can check out the forecasts from the analysts covering DUG Technology for free.
What The Trend Of ROCE Can Tell Us
DUG Technology is displaying some positive trends. Over the last five years, returns on capital employed have risen substantially to 21%. The company is effectively making more money per dollar of capital used, and it's worth noting that the amount of capital has increased too, by 29%. This can indicate that there's plenty of opportunities to invest capital internally and at ever higher rates, a combination that's common among multi-baggers.
For the record though, there was a noticeable increase in the company's current liabilities over the period, so we would attribute some of the ROCE growth to that. Essentially the business now has suppliers or short-term creditors funding about 37% of its operations, which isn't ideal. Keep an eye out for future increases because when the ratio of current liabilities to total assets gets particularly high, this can introduce some new risks for the business.
The Bottom Line
All in all, it's terrific to see that DUG Technology is reaping the rewards from prior investments and is growing its capital base. And with the stock having performed exceptionally well over the last three years, these patterns are being accounted for by investors. With that being said, we still think the promising fundamentals mean the company deserves some further due diligence.
If you want to continue researching DUG Technology, you might be interested to know about the 1 warning sign that our analysis has discovered.
If you want to search for more stocks that have been earning high returns, check out this free list of stocks with solid balance sheets that are also earning high returns on equity.
Have feedback on this article? Concerned about the content? Get in touch with us directly. Alternatively, email editorial-team (at) simplywallst.com.
This article by Simply Wall St is general in nature. We provide commentary based on historical data and analyst forecasts only using an unbiased methodology and our articles are not intended to be financial advice. It does not constitute a recommendation to buy or sell any stock, and does not take account of your objectives, or your financial situation. We aim to bring you long-term focused analysis driven by fundamental data. Note that our analysis may not factor in the latest price-sensitive company announcements or qualitative material. Simply Wall St has no position in any stocks mentioned.
