
AUCMALtd (SHSE:600336) has had a rough three months with its share price down 14%. But if you pay close attention, you might find that its key financial indicators look quite decent, which could mean that the stock could potentially rise in the long-term given how markets usually reward more resilient long-term fundamentals. Particularly, we will be paying attention to AUCMALtd's ROE today.
Return on Equity or ROE is a test of how effectively a company is growing its value and managing investors' money. Simply put, it is used to assess the profitability of a company in relation to its equity capital.
How Do You Calculate Return On Equity?
Return on equity can be calculated by using the formula:
Return on Equity = Net Profit (from continuing operations) ÷ Shareholders' Equity
So, based on the above formula, the ROE for AUCMALtd is:
3.9% = CN¥108m ÷ CN¥2.8b (Based on the trailing twelve months to September 2023).
The 'return' is the profit over the last twelve months. One way to conceptualize this is that for each CN¥1 of shareholders' capital it has, the company made CN¥0.04 in profit.
What Has ROE Got To Do With Earnings Growth?
So far, we've learned that ROE is a measure of a company's profitability. We now need to evaluate how much profit the company reinvests or "retains" for future growth which then gives us an idea about the growth potential of the company. Assuming everything else remains unchanged, the higher the ROE and profit retention, the higher the growth rate of a company compared to companies that don't necessarily bear these characteristics.
AUCMALtd's Earnings Growth And 3.9% ROE
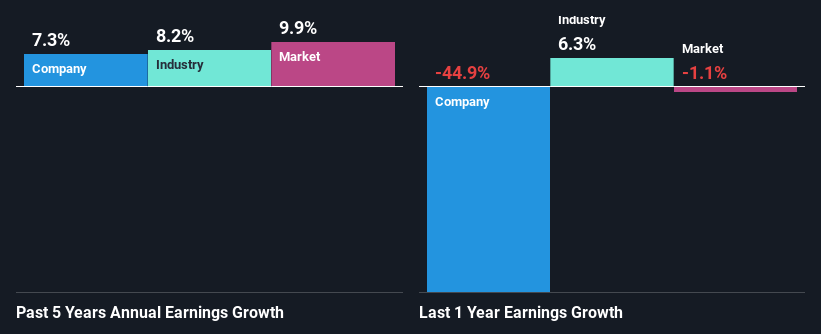
It is quite clear that AUCMALtd's ROE is rather low. Even when compared to the industry average of 11%, the ROE figure is pretty disappointing. AUCMALtd was still able to see a decent net income growth of 7.3% over the past five years. Therefore, the growth in earnings could probably have been caused by other variables. For instance, the company has a low payout ratio or is being managed efficiently.
We then performed a comparison between AUCMALtd's net income growth with the industry, which revealed that the company's growth is similar to the average industry growth of 8.2% in the same 5-year period.
Earnings growth is an important metric to consider when valuing a stock. It's important for an investor to know whether the market has priced in the company's expected earnings growth (or decline). By doing so, they will have an idea if the stock is headed into clear blue waters or if swampy waters await. If you're wondering about AUCMALtd's's valuation, check out this gauge of its price-to-earnings ratio, as compared to its industry.
Is AUCMALtd Making Efficient Use Of Its Profits?
With a three-year median payout ratio of 34% (implying that the company retains 66% of its profits), it seems that AUCMALtd is reinvesting efficiently in a way that it sees respectable amount growth in its earnings and pays a dividend that's well covered.
Besides, AUCMALtd has been paying dividends over a period of six years. This shows that the company is committed to sharing profits with its shareholders.
Summary
In total, it does look like AUCMALtd has some positive aspects to its business. Despite its low rate of return, the fact that the company reinvests a very high portion of its profits into its business, no doubt contributed to its high earnings growth. While we won't completely dismiss the company, what we would do, is try to ascertain how risky the business is to make a more informed decision around the company. You can see the 3 risks we have identified for AUCMALtd by visiting our risks dashboard for free on our platform here.
Have feedback on this article? Concerned about the content? Get in touch with us directly. Alternatively, email editorial-team (at) simplywallst.com.
This article by Simply Wall St is general in nature. We provide commentary based on historical data and analyst forecasts only using an unbiased methodology and our articles are not intended to be financial advice. It does not constitute a recommendation to buy or sell any stock, and does not take account of your objectives, or your financial situation. We aim to bring you long-term focused analysis driven by fundamental data. Note that our analysis may not factor in the latest price-sensitive company announcements or qualitative material. Simply Wall St has no position in any stocks mentioned.