
Key Insights
- Significant insider control over Appian implies vested interests in company growth
- 53% of the business is held by the top 3 shareholders
- Institutions own 36% of Appian
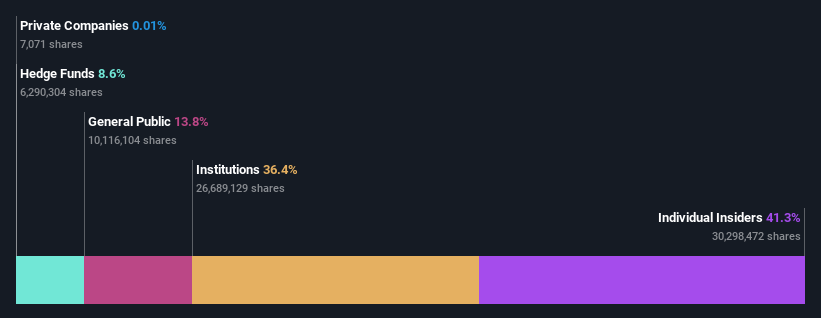
If you want to know who really controls Appian Corporation (NASDAQ:APPN), then you'll have to look at the makeup of its share registry. And the group that holds the biggest piece of the pie are individual insiders with 41% ownership. Put another way, the group faces the maximum upside potential (or downside risk).
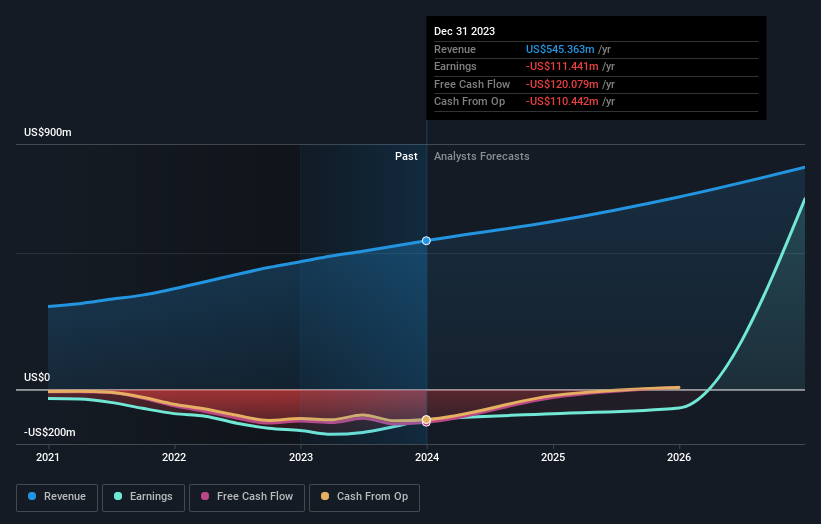
As a result, insiders as a group endured the highest losses after market cap fell by US$388m.
Let's delve deeper into each type of owner of Appian, beginning with the chart below.
What Does The Institutional Ownership Tell Us About Appian?
 Many institutions measure their performance against an index that approximates the local market. So they usually pay more attention to companies that are included in major indices.
Appian already has institutions on the share registry. Indeed, they own a respectable stake in the company. This can indicate that the company has a certain degree of credibility in the investment community. However, it is best to be wary of relying on the supposed validation that comes with institutional investors. They too, get it wrong sometimes. When multiple institutions own a stock, there's always a risk that they are in a 'crowded trade'. When such a trade goes wrong, multiple parties may compete to sell stock fast. This risk is higher in a company without a history of growth. You can see Appian's historic earnings and revenue below, but keep in mind there's always more to the story.
It would appear that 8.6% of Appian shares are controlled by hedge funds. That catches my attention because hedge funds sometimes try to influence management, or bring about changes that will create near term value for shareholders. With a 38% stake, CEO Matthew Calkins is the largest shareholder. With 8.6% and 6.4% of the shares outstanding respectively, Abdiel Capital Advisors, LP and The Vanguard Group, Inc. are the second and third largest shareholders.
A more detailed study of the shareholder registry showed us that 3 of the top shareholders have a considerable amount of ownership in the company, via their 53% stake.
Researching institutional ownership is a good way to gauge and filter a stock's expected performance. The same can be achieved by studying analyst sentiments. Quite a few analysts cover the stock, so you could look into forecast growth quite easily.
Insider Ownership Of Appian
While the precise definition of an insider can be subjective, almost everyone considers board members to be insiders. The company management answer to the board and the latter should represent the interests of shareholders. Notably, sometimes top-level managers are on the board themselves.
Insider ownership is positive when it signals leadership are thinking like the true owners of the company. However, high insider ownership can also give immense power to a small group within the company. This can be negative in some circumstances.
Our most recent data indicates that insiders own a reasonable proportion of Appian Corporation. Insiders own US$968m worth of shares in the US$2.3b company. That's quite meaningful. Most would say this shows a good degree of alignment with shareholders, especially in a company of this size. You can click here to see if those insiders have been buying or selling.
General Public Ownership
The general public, who are usually individual investors, hold a 14% stake in Appian. While this size of ownership may not be enough to sway a policy decision in their favour, they can still make a collective impact on company policies.
Next Steps:
I find it very interesting to look at who exactly owns a company. But to truly gain insight, we need to consider other information, too.
I like to dive deeper into how a company has performed in the past. You can find historic revenue and earnings in this detailed graph.
If you would prefer discover what analysts are predicting in terms of future growth, do not miss this free report on analyst forecasts.
NB: Figures in this article are calculated using data from the last twelve months, which refer to the 12-month period ending on the last date of the month the financial statement is dated. This may not be consistent with full year annual report figures.
Have feedback on this article? Concerned about the content? Get in touch with us directly. Alternatively, email editorial-team (at) simplywallst.com.
This article by Simply Wall St is general in nature. We provide commentary based on historical data and analyst forecasts only using an unbiased methodology and our articles are not intended to be financial advice. It does not constitute a recommendation to buy or sell any stock, and does not take account of your objectives, or your financial situation. We aim to bring you long-term focused analysis driven by fundamental data. Note that our analysis may not factor in the latest price-sensitive company announcements or qualitative material. Simply Wall St has no position in any stocks mentioned.