Fu Shou Yuan International Group Limited (HKG:1448) shareholders should be happy to see the share price up 11% in the last month. It's not great that the stock is down over the last three years. But on the bright side, its return of -32%, is better than the market, which is down 29%.
Although the past week has been more reassuring for shareholders, they're still in the red over the last three years, so let's see if the underlying business has been responsible for the decline.
In his essay The Superinvestors of Graham-and-Doddsville Warren Buffett described how share prices do not always rationally reflect the value of a business. One flawed but reasonable way to assess how sentiment around a company has changed is to compare the earnings per share (EPS) with the share price.
During the unfortunate three years of share price decline, Fu Shou Yuan International Group actually saw its earnings per share (EPS) improve by 17% per year. Given the share price reaction, one might suspect that EPS is not a good guide to the business performance during the period (perhaps due to a one-off loss or gain). Alternatively, growth expectations may have been unreasonable in the past.
Since the change in EPS doesn't seem to correlate with the change in share price, it's worth taking a look at other metrics.
Revenue is actually up 11% over the three years, so the share price drop doesn't seem to hinge on revenue, either. It's probably worth investigating Fu Shou Yuan International Group further; while we may be missing something on this analysis, there might also be an opportunity.
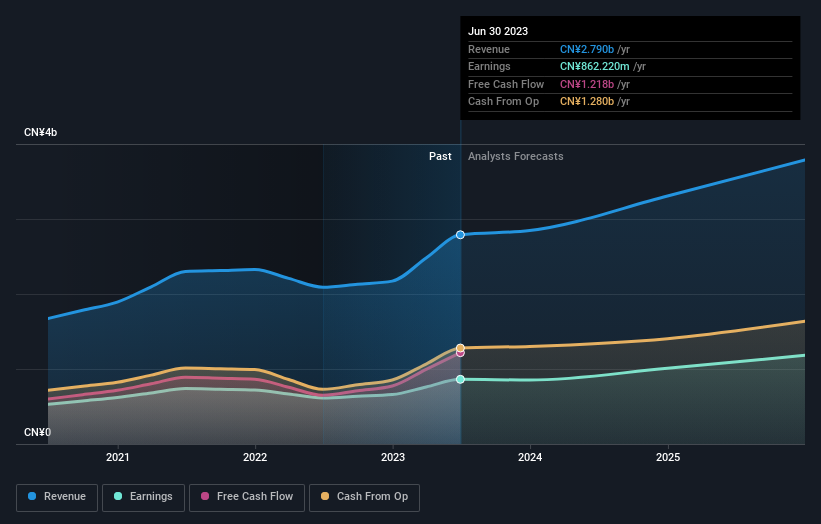
You can see below how earnings and revenue have changed over time (discover the exact values by clicking on the image).
SEHK:1448 Earnings and Revenue Growth February 23rd 2024
We know that Fu Shou Yuan International Group has improved its bottom line lately, but what does the future have in store? So we recommend checking out this free report showing consensus forecasts
What About Dividends?
When looking at investment returns, it is important to consider the difference between total shareholder return (TSR) and share price return. Whereas the share price return only reflects the change in the share price, the TSR includes the value of dividends (assuming they were reinvested) and the benefit of any discounted capital raising or spin-off. It's fair to say that the TSR gives a more complete picture for stocks that pay a dividend. As it happens, Fu Shou Yuan International Group's TSR for the last 3 years was -27%, which exceeds the share price return mentioned earlier. And there's no prize for guessing that the dividend payments largely explain the divergence!
A Different Perspective
The total return of 9.9% received by Fu Shou Yuan International Group shareholders over the last year isn't far from the market return of -10%. So last year was actually even worse than the last five years, which cost shareholders 3% per year. Weak performance over the long term usually destroys market confidence in a stock, but bargain hunters may want to take a closer look for signs of a turnaround. Importantly, we haven't analysed Fu Shou Yuan International Group's dividend history. This free visual report on its dividends is a must-read if you're thinking of buying.
Of course, you might find a fantastic investment by looking elsewhere. So take a peek at this free list of companies we expect will grow earnings.
Please note, the market returns quoted in this article reflect the market weighted average returns of stocks that currently trade on Hong Kong exchanges.
Have feedback on this article? Concerned about the content? Get in touch with us directly. Alternatively, email editorial-team (at) simplywallst.com.
This article by Simply Wall St is general in nature. We provide commentary based on historical data and analyst forecasts only using an unbiased methodology and our articles are not intended to be financial advice. It does not constitute a recommendation to buy or sell any stock, and does not take account of your objectives, or your financial situation. We aim to bring you long-term focused analysis driven by fundamental data. Note that our analysis may not factor in the latest price-sensitive company announcements or qualitative material. Simply Wall St has no position in any stocks mentioned.
福壽園國際集團有限公司(HKG: 1448)的股東應該很高興看到上個月股價上漲了11%。該股在過去三年中下跌並不是一件好事。但好的一面是,其回報率爲-32%,好於下跌29%的市場。
儘管過去一週令股東更加放心,但在過去三年中,他們仍處於虧損狀態,因此,讓我們看看基礎業務是否是下跌的原因。
禾倫·巴菲特在他的文章《格雷厄姆和多茲維爾的超級投資者》中描述了股價如何並不總是能合理地反映企業的價值。評估公司情緒變化的一種有缺陷但合理的方法是將每股收益(EPS)與股價進行比較。
在不幸的三年股價下跌中,福壽園國際集團的每股收益(EPS)實際上每年增長17%。鑑於股價的反應,人們可能會懷疑每股收益並不能很好地指導該期間的業務表現(可能是由於一次性的虧損或收益)。或者,過去的增長預期可能不合理。
由於每股收益的變化似乎與股價的變化無關,因此值得一看其他指標。
在過去的三年中,收入實際上增長了11%,因此股價下跌似乎也不取決於收入。可能值得進一步調查福壽園國際集團;雖然我們在分析中可能遺漏了一些東西,但也可能有機會。
您可以在下面看到收入和收入如何隨着時間的推移而變化(點擊圖片了解確切的值)。
SEHK: 1448 2024年2月23日收益及收入增長
我們知道福壽園國際集團最近提高了利潤,但是未來會怎樣?因此,我們建議您查看這份顯示共識預測的免費報告
分紅呢?
在考慮投資回報時,重要的是要考慮股東總回報(TSR)和股價回報率之間的差異。儘管股價回報率僅反映股價的變化,但股東總回報率包括股息的價值(假設已進行再投資)以及任何折扣融資或分拆的收益。可以公平地說,股東總回報率爲支付股息的股票提供了更完整的畫面。碰巧的是,福壽園國際集團過去3年的股東總回報率爲-27%,超過了前面提到的股價回報率。而且,猜測股息支付在很大程度上解釋了這種分歧是沒有好處的!
不同的視角
去年,福壽園國際集團股東獲得的9.9%的總回報率與-10%的市場回報率相差不遠。因此,去年的情況實際上比過去五年還要糟糕,後者每年使股東損失3%。長期表現疲軟通常會破壞市場對股票的信心,但討價還價者可能需要仔細觀察轉機的跡象。重要的是,我們還沒有分析福壽園國際集團的分紅歷史。如果你想購買,這份關於其股息的免費可視化報告是必讀的。
當然,通過尋找其他地方,你可能會找到一筆不錯的投資。因此,請看一下我們預計收益將增加的這份免費公司名單。
請注意,本文引用的市場回報反映了目前在香港交易所交易的股票的市場加權平均回報。
對這篇文章有反饋嗎?對內容感到擔憂嗎?請直接聯繫我們。或者,也可以發送電子郵件至編輯團隊 (at) simplywallst.com。
Simply Wall St的這篇文章本質上是籠統的。我們僅使用公正的方法根據歷史數據和分析師的預測提供評論,我們的文章無意作爲財務建議。它不構成買入或賣出任何股票的建議,也沒有考慮到您的目標或財務狀況。我們的目標是爲您提供由基本數據驅動的長期重點分析。請注意,我們的分析可能不考慮最新的價格敏感型公司公告或定性材料。簡而言之,華爾街沒有持有任何上述股票的頭寸。