
The main aim of stock picking is to find the market-beating stocks. But in any portfolio, there will be mixed results between individual stocks. At this point some shareholders may be questioning their investment in CMST Development Co.,Ltd. (SHSE:600787), since the last five years saw the share price fall 11%.
While the last five years has been tough for CMST DevelopmentLtd shareholders, this past week has shown signs of promise. So let's look at the longer term fundamentals and see if they've been the driver of the negative returns.
While the efficient markets hypothesis continues to be taught by some, it has been proven that markets are over-reactive dynamic systems, and investors are not always rational. By comparing earnings per share (EPS) and share price changes over time, we can get a feel for how investor attitudes to a company have morphed over time.
While the share price declined over five years, CMST DevelopmentLtd actually managed to increase EPS by an average of 21% per year. Given the share price reaction, one might suspect that EPS is not a good guide to the business performance during the period (perhaps due to a one-off loss or gain). Alternatively, growth expectations may have been unreasonable in the past.
It is unusual to see such modest share price growth in the face of sustained EPS improvements. We can look to other metrics to try to understand the situation better.
In contrast to the share price, revenue has actually increased by 19% a year in the five year period. So it seems one might have to take closer look at the fundamentals to understand why the share price languishes. After all, there may be an opportunity.
You can see how earnings and revenue have changed over time in the image below (click on the chart to see the exact values).
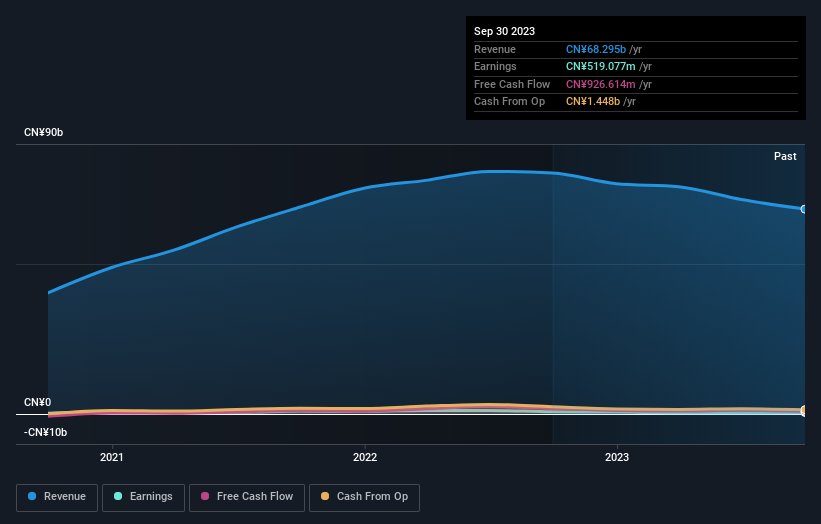
Balance sheet strength is crucial. It might be well worthwhile taking a look at our free report on how its financial position has changed over time.
What About Dividends?
It is important to consider the total shareholder return, as well as the share price return, for any given stock. The TSR is a return calculation that accounts for the value of cash dividends (assuming that any dividend received was reinvested) and the calculated value of any discounted capital raisings and spin-offs. So for companies that pay a generous dividend, the TSR is often a lot higher than the share price return. In the case of CMST DevelopmentLtd, it has a TSR of -4.7% for the last 5 years. That exceeds its share price return that we previously mentioned. This is largely a result of its dividend payments!
A Different Perspective
While it's never nice to take a loss, CMST DevelopmentLtd shareholders can take comfort that , including dividends,their trailing twelve month loss of 4.1% wasn't as bad as the market loss of around 22%. Given the total loss of 0.9% per year over five years, it seems returns have deteriorated in the last twelve months. Whilst Baron Rothschild does tell the investor "buy when there's blood in the streets, even if the blood is your own", buyers would need to examine the data carefully to be comfortable that the business itself is sound. It's always interesting to track share price performance over the longer term. But to understand CMST DevelopmentLtd better, we need to consider many other factors. For example, we've discovered 2 warning signs for CMST DevelopmentLtd that you should be aware of before investing here.
If you are like me, then you will not want to miss this free list of growing companies that insiders are buying.
Please note, the market returns quoted in this article reflect the market weighted average returns of stocks that currently trade on Chinese exchanges.
Have feedback on this article? Concerned about the content? Get in touch with us directly. Alternatively, email editorial-team (at) simplywallst.com.
This article by Simply Wall St is general in nature. We provide commentary based on historical data and analyst forecasts only using an unbiased methodology and our articles are not intended to be financial advice. It does not constitute a recommendation to buy or sell any stock, and does not take account of your objectives, or your financial situation. We aim to bring you long-term focused analysis driven by fundamental data. Note that our analysis may not factor in the latest price-sensitive company announcements or qualitative material. Simply Wall St has no position in any stocks mentioned.