
In order to justify the effort of selecting individual stocks, it's worth striving to beat the returns from a market index fund. But every investor is virtually certain to have both over-performing and under-performing stocks. So we wouldn't blame long term Sanjiang Shopping Club Co.,Ltd (SHSE:601116) shareholders for doubting their decision to hold, with the stock down 29% over a half decade. And we doubt long term believers are the only worried holders, since the stock price has declined 22% over the last twelve months. The falls have accelerated recently, with the share price down 29% in the last three months. Of course, this share price action may well have been influenced by the 17% decline in the broader market, throughout the period.
Since Sanjiang Shopping ClubLtd has shed CN¥526m from its value in the past 7 days, let's see if the longer term decline has been driven by the business' economics.
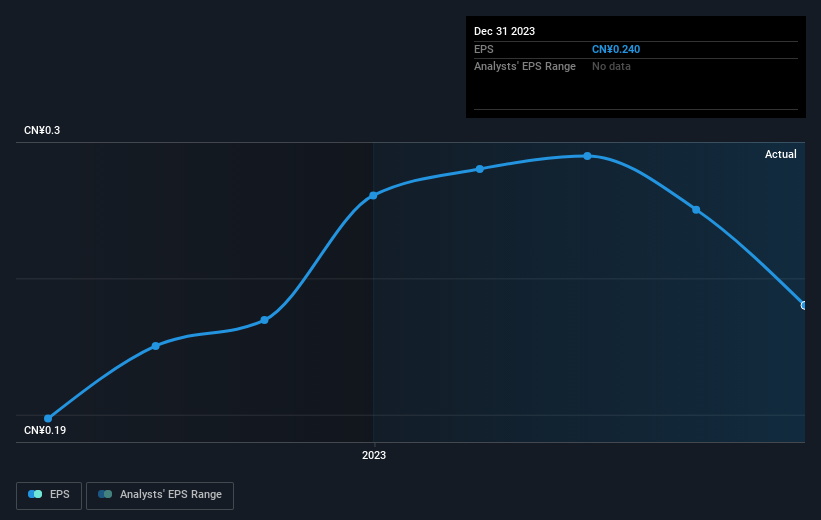
While the efficient markets hypothesis continues to be taught by some, it has been proven that markets are over-reactive dynamic systems, and investors are not always rational. One imperfect but simple way to consider how the market perception of a company has shifted is to compare the change in the earnings per share (EPS) with the share price movement.
During the five years over which the share price declined, Sanjiang Shopping ClubLtd's earnings per share (EPS) dropped by 0.4% each year. This reduction in EPS is less than the 7% annual reduction in the share price. This implies that the market was previously too optimistic about the stock.
You can see below how EPS has changed over time (discover the exact values by clicking on the image).
It might be well worthwhile taking a look at our free report on Sanjiang Shopping ClubLtd's earnings, revenue and cash flow.
What About Dividends?
As well as measuring the share price return, investors should also consider the total shareholder return (TSR). Whereas the share price return only reflects the change in the share price, the TSR includes the value of dividends (assuming they were reinvested) and the benefit of any discounted capital raising or spin-off. It's fair to say that the TSR gives a more complete picture for stocks that pay a dividend. In the case of Sanjiang Shopping ClubLtd, it has a TSR of -23% for the last 5 years. That exceeds its share price return that we previously mentioned. This is largely a result of its dividend payments!
A Different Perspective
While it's never nice to take a loss, Sanjiang Shopping ClubLtd shareholders can take comfort that , including dividends,their trailing twelve month loss of 20% wasn't as bad as the market loss of around 24%. Unfortunately, last year's performance may indicate unresolved challenges, given that it's worse than the annualised loss of 4% over the last half decade. While some investors do well specializing in buying companies that are struggling (but nonetheless undervalued), don't forget that Buffett said that 'turnarounds seldom turn'. I find it very interesting to look at share price over the long term as a proxy for business performance. But to truly gain insight, we need to consider other information, too. For instance, we've identified 2 warning signs for Sanjiang Shopping ClubLtd (1 is a bit concerning) that you should be aware of.
If you would prefer to check out another company -- one with potentially superior financials -- then do not miss this free list of companies that have proven they can grow earnings.
Please note, the market returns quoted in this article reflect the market weighted average returns of stocks that currently trade on Chinese exchanges.
Have feedback on this article? Concerned about the content? Get in touch with us directly. Alternatively, email editorial-team (at) simplywallst.com.
This article by Simply Wall St is general in nature. We provide commentary based on historical data and analyst forecasts only using an unbiased methodology and our articles are not intended to be financial advice. It does not constitute a recommendation to buy or sell any stock, and does not take account of your objectives, or your financial situation. We aim to bring you long-term focused analysis driven by fundamental data. Note that our analysis may not factor in the latest price-sensitive company announcements or qualitative material. Simply Wall St has no position in any stocks mentioned.