
Fujian Dongbai (Group) Co.,Ltd. (SHSE:600693) shareholders that were waiting for something to happen have been dealt a blow with a 26% share price drop in the last month. The drop over the last 30 days has capped off a tough year for shareholders, with the share price down 30% in that time.
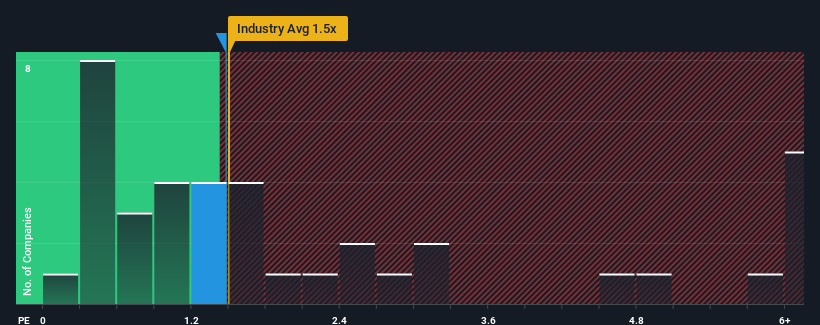
Although its price has dipped substantially, you could still be forgiven for feeling indifferent about Fujian Dongbai (Group)Ltd's P/S ratio of 1.5x, since the median price-to-sales (or "P/S") ratio for the Multiline Retail industry in China is about the same. While this might not raise any eyebrows, if the P/S ratio is not justified investors could be missing out on a potential opportunity or ignoring looming disappointment.
What Does Fujian Dongbai (Group)Ltd's Recent Performance Look Like?
As an illustration, revenue has deteriorated at Fujian Dongbai (Group)Ltd over the last year, which is not ideal at all. Perhaps investors believe the recent revenue performance is enough to keep in line with the industry, which is keeping the P/S from dropping off. If not, then existing shareholders may be a little nervous about the viability of the share price.
Although there are no analyst estimates available for Fujian Dongbai (Group)Ltd, take a look at this free data-rich visualisation to see how the company stacks up on earnings, revenue and cash flow.How Is Fujian Dongbai (Group)Ltd's Revenue Growth Trending?
Fujian Dongbai (Group)Ltd's P/S ratio would be typical for a company that's only expected to deliver moderate growth, and importantly, perform in line with the industry.
Retrospectively, the last year delivered a frustrating 1.7% decrease to the company's top line. The last three years don't look nice either as the company has shrunk revenue by 32% in aggregate. So unfortunately, we have to acknowledge that the company has not done a great job of growing revenue over that time.
Comparing that to the industry, which is predicted to deliver 24% growth in the next 12 months, the company's downward momentum based on recent medium-term revenue results is a sobering picture.
In light of this, it's somewhat alarming that Fujian Dongbai (Group)Ltd's P/S sits in line with the majority of other companies. Apparently many investors in the company are way less bearish than recent times would indicate and aren't willing to let go of their stock right now. Only the boldest would assume these prices are sustainable as a continuation of recent revenue trends is likely to weigh on the share price eventually.
The Key Takeaway
With its share price dropping off a cliff, the P/S for Fujian Dongbai (Group)Ltd looks to be in line with the rest of the Multiline Retail industry. Generally, our preference is to limit the use of the price-to-sales ratio to establishing what the market thinks about the overall health of a company.
The fact that Fujian Dongbai (Group)Ltd currently trades at a P/S on par with the rest of the industry is surprising to us since its recent revenues have been in decline over the medium-term, all while the industry is set to grow. Even though it matches the industry, we're uncomfortable with the current P/S ratio, as this dismal revenue performance is unlikely to support a more positive sentiment for long. Unless the the circumstances surrounding the recent medium-term improve, it wouldn't be wrong to expect a a difficult period ahead for the company's shareholders.
Having said that, be aware Fujian Dongbai (Group)Ltd is showing 4 warning signs in our investment analysis, and 3 of those don't sit too well with us.
It's important to make sure you look for a great company, not just the first idea you come across. So if growing profitability aligns with your idea of a great company, take a peek at this free list of interesting companies with strong recent earnings growth (and a low P/E).
Have feedback on this article? Concerned about the content? Get in touch with us directly. Alternatively, email editorial-team (at) simplywallst.com.
This article by Simply Wall St is general in nature. We provide commentary based on historical data and analyst forecasts only using an unbiased methodology and our articles are not intended to be financial advice. It does not constitute a recommendation to buy or sell any stock, and does not take account of your objectives, or your financial situation. We aim to bring you long-term focused analysis driven by fundamental data. Note that our analysis may not factor in the latest price-sensitive company announcements or qualitative material. Simply Wall St has no position in any stocks mentioned.