
The Changchun Yidong Clutch CO.,LTD (SHSE:600148) share price has fared very poorly over the last month, falling by a substantial 30%. The drop over the last 30 days has capped off a tough year for shareholders, with the share price down 23% in that time.
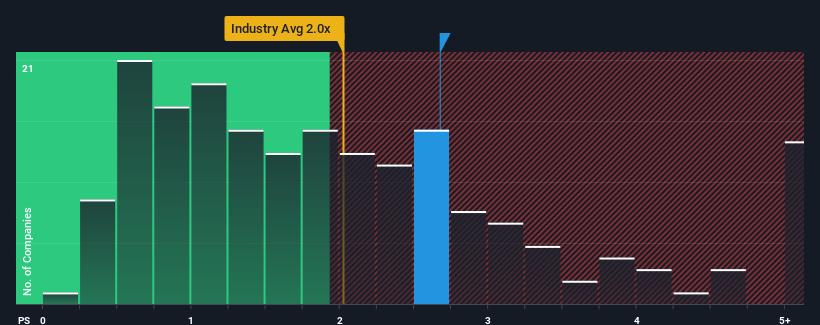
Even after such a large drop in price, when almost half of the companies in China's Auto Components industry have price-to-sales ratios (or "P/S") below 2x, you may still consider Changchun Yidong ClutchLTD as a stock probably not worth researching with its 2.7x P/S ratio. Nonetheless, we'd need to dig a little deeper to determine if there is a rational basis for the elevated P/S.
What Does Changchun Yidong ClutchLTD's Recent Performance Look Like?
For example, consider that Changchun Yidong ClutchLTD's financial performance has been pretty ordinary lately as revenue growth is non-existent. Perhaps the market believes that revenue growth will improve markedly over current levels, inflating the P/S ratio. However, if this isn't the case, investors might get caught out paying too much for the stock.
We don't have analyst forecasts, but you can see how recent trends are setting up the company for the future by checking out our free report on Changchun Yidong ClutchLTD's earnings, revenue and cash flow.How Is Changchun Yidong ClutchLTD's Revenue Growth Trending?
Changchun Yidong ClutchLTD's P/S ratio would be typical for a company that's expected to deliver solid growth, and importantly, perform better than the industry.
Taking a look back first, we see that there was hardly any revenue growth to speak of for the company over the past year. Whilst it's an improvement, it wasn't enough to get the company out of the hole it was in, with revenue down 48% overall from three years ago. Accordingly, shareholders would have felt downbeat about the medium-term rates of revenue growth.
Comparing that to the industry, which is predicted to deliver 25% growth in the next 12 months, the company's downward momentum based on recent medium-term revenue results is a sobering picture.
With this information, we find it concerning that Changchun Yidong ClutchLTD is trading at a P/S higher than the industry. Apparently many investors in the company are way more bullish than recent times would indicate and aren't willing to let go of their stock at any price. Only the boldest would assume these prices are sustainable as a continuation of recent revenue trends is likely to weigh heavily on the share price eventually.
The Bottom Line On Changchun Yidong ClutchLTD's P/S
Changchun Yidong ClutchLTD's P/S remain high even after its stock plunged. Typically, we'd caution against reading too much into price-to-sales ratios when settling on investment decisions, though it can reveal plenty about what other market participants think about the company.
We've established that Changchun Yidong ClutchLTD currently trades on a much higher than expected P/S since its recent revenues have been in decline over the medium-term. Right now we aren't comfortable with the high P/S as this revenue performance is highly unlikely to support such positive sentiment for long. Unless the the circumstances surrounding the recent medium-term improve, it wouldn't be wrong to expect a a difficult period ahead for the company's shareholders.
Having said that, be aware Changchun Yidong ClutchLTD is showing 2 warning signs in our investment analysis, and 1 of those is a bit unpleasant.
If these risks are making you reconsider your opinion on Changchun Yidong ClutchLTD, explore our interactive list of high quality stocks to get an idea of what else is out there.
Have feedback on this article? Concerned about the content? Get in touch with us directly. Alternatively, email editorial-team (at) simplywallst.com.
This article by Simply Wall St is general in nature. We provide commentary based on historical data and analyst forecasts only using an unbiased methodology and our articles are not intended to be financial advice. It does not constitute a recommendation to buy or sell any stock, and does not take account of your objectives, or your financial situation. We aim to bring you long-term focused analysis driven by fundamental data. Note that our analysis may not factor in the latest price-sensitive company announcements or qualitative material. Simply Wall St has no position in any stocks mentioned.