
Nanning Department Store Co., Ltd. (SHSE:600712) shareholders won't be pleased to see that the share price has had a very rough month, dropping 29% and undoing the prior period's positive performance. The drop over the last 30 days has capped off a tough year for shareholders, with the share price down 15% in that time.
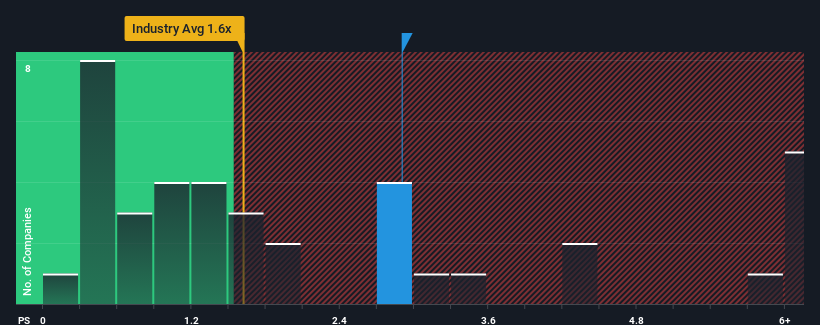
Although its price has dipped substantially, when almost half of the companies in China's Multiline Retail industry have price-to-sales ratios (or "P/S") below 1.6x, you may still consider Nanning Department Store as a stock probably not worth researching with its 2.9x P/S ratio. Nonetheless, we'd need to dig a little deeper to determine if there is a rational basis for the elevated P/S.
How Nanning Department Store Has Been Performing
As an illustration, revenue has deteriorated at Nanning Department Store over the last year, which is not ideal at all. One possibility is that the P/S is high because investors think the company will still do enough to outperform the broader industry in the near future. You'd really hope so, otherwise you're paying a pretty hefty price for no particular reason.
We don't have analyst forecasts, but you can see how recent trends are setting up the company for the future by checking out our free report on Nanning Department Store's earnings, revenue and cash flow.Is There Enough Revenue Growth Forecasted For Nanning Department Store?
The only time you'd be truly comfortable seeing a P/S as high as Nanning Department Store's is when the company's growth is on track to outshine the industry.
Retrospectively, the last year delivered a frustrating 8.2% decrease to the company's top line. As a result, revenue from three years ago have also fallen 38% overall. Therefore, it's fair to say the revenue growth recently has been undesirable for the company.
Weighing that medium-term revenue trajectory against the broader industry's one-year forecast for expansion of 24% shows it's an unpleasant look.
In light of this, it's alarming that Nanning Department Store's P/S sits above the majority of other companies. It seems most investors are ignoring the recent poor growth rate and are hoping for a turnaround in the company's business prospects. There's a very good chance existing shareholders are setting themselves up for future disappointment if the P/S falls to levels more in line with the recent negative growth rates.
The Key Takeaway
Despite the recent share price weakness, Nanning Department Store's P/S remains higher than most other companies in the industry. Generally, our preference is to limit the use of the price-to-sales ratio to establishing what the market thinks about the overall health of a company.
We've established that Nanning Department Store currently trades on a much higher than expected P/S since its recent revenues have been in decline over the medium-term. Right now we aren't comfortable with the high P/S as this revenue performance is highly unlikely to support such positive sentiment for long. Should recent medium-term revenue trends persist, it would pose a significant risk to existing shareholders' investments and prospective investors will have a hard time accepting the current value of the stock.
There are also other vital risk factors to consider before investing and we've discovered 2 warning signs for Nanning Department Store that you should be aware of.
Of course, profitable companies with a history of great earnings growth are generally safer bets. So you may wish to see this free collection of other companies that have reasonable P/E ratios and have grown earnings strongly.
Have feedback on this article? Concerned about the content? Get in touch with us directly. Alternatively, email editorial-team (at) simplywallst.com.
This article by Simply Wall St is general in nature. We provide commentary based on historical data and analyst forecasts only using an unbiased methodology and our articles are not intended to be financial advice. It does not constitute a recommendation to buy or sell any stock, and does not take account of your objectives, or your financial situation. We aim to bring you long-term focused analysis driven by fundamental data. Note that our analysis may not factor in the latest price-sensitive company announcements or qualitative material. Simply Wall St has no position in any stocks mentioned.