
Source: CICC Strategy
Authors: Liu Gang, Li Yujie, Yang Xuanting
Looking back at January, under the influence of factors such as the Federal Reserve being hawkish again and stronger economic data, expectations of interest rate cuts repeatedly caused assets to “turn back and forth.” Looking ahead to February, we believe that in the current situation, the direction of interest rate cuts is more important than the timing, and investor positions are more important than the pace. How are assets allocated before interest rate cuts begin?
1. The pace of this round of interest rate cut transactions: March is too early, May is not too late; the “first half” is more certain than the “second half”
We believe that whether interest rates are cut in March or May, there will be no real impact on assets. Compared to when interest rate cuts began, the path variables after starting are likely to be larger. Currently, the financing costs borne by various departments in the US are actually not that high, and demand is likely to recover after interest rates are adjusted slightly. We estimate that if interest rates on US bonds fall back to 3.5% to 3.8%, existing home sales may rebound 1% in 2024. The greater the decline in interest rates, the higher the sales rebound; corporate investment expectations are also bottoming out. As a result, subsequent interest rate cuts are not necessary. The “first half” of the transaction is not a big problem, but the “second half” cannot be extrapolated linearly.
2. Asset performance before successive interest rate cuts: gold on long-term bonds first, then major US stocks
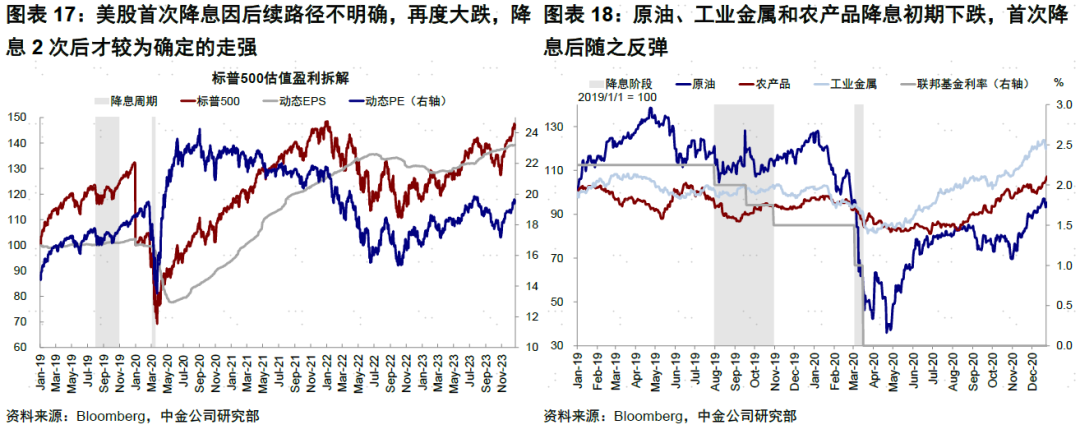
We have reviewed every cycle of interest rate cuts since 1994 and found that trading opportunities for bonds and gold are generally better at the stage where interest rate cuts are expected, and that the increase phase of US stocks lags behind. In particular, the 2019 interest rate cut phase, which is more comparable to the current situation, shows that long-term US bonds and gold rose higher during the expected period of interest rate cuts. Interest rates on bonds rebounded after interest rate cuts began, and gold continued to fall. On the other hand, due to the uncertain path of interest rate cuts, there was still pressure to pull back when interest rate cuts began, and only strengthened more definitely after cutting interest rates 2 times.
3. How to start trading interest rate cuts? It is expected that “back-and-forth” will provide better buying opportunities for bond gold, and wait for twists and turns before buying US stocks
Judging from the number of interest rate cuts currently included in each asset and future space, bonds and gold are more attractive. We think now is the time to lay out gold for long-term bonds. After cutting interest rates a few times, we can switch to US stocks. Currently, expectations for interest rate cuts included in gold on US bonds have declined markedly, and the allocation window has been opened. After cutting interest rates a few times, due to gradual improvement in growth, subsequent policy paths cannot be extrapolated linearly. At that time, the allocation opportunities for long-term US bonds and gold may gradually decrease after demand improves, and gradually shift to US stocks that switch from the denominator side to the molecular side logic.
In January 2024, interest rate cuts were expected to be repeated, causing major assets to “turn back and forth”. The probability that the Federal Reserve will cut interest rates in March fell from close to 60% to 30% due to factors such as economic data such as an unexpected shift in the FOMC in December until the FOMC once again “knocked on” market expectations in January. As a result, the 10-year US Treasury interest rate basically fluctuated around 4% after rising from 3.8% to 4.2%, returning to the starting point before the FOMC in December. This is consistent with our previous view that the fundamentals of interest rate cuts do not support cutting interest rates too fast, because the intensity of austerity is “just right” from the perspective of squeezing the needs of various departments. In this context, although there was a slight correction at the end of the month, US stocks were resilient. Technology leaders continued to drive the rise in US stocks. MAAMNG rose 4.2% in January, leading the world's major assets.
Looking ahead to February, interest rate cuts will still be a game over and over again. Although interest rate cuts are expected to cool down in March, we believe that in the current situation, the direction of interest rate cuts is more important than the timing, and investor positions are more important than the pace. As far as assets are concerned, there is actually no big difference between cutting interest rates in March or May; it is nothing more than a “turnaround” caused by anticipated swings and games. However, as long as the direction of interest rate cuts is clear, it is still time to lay out interest rate cut deals from now until the interest rate is cut; it is not over yet. Therefore, on the one hand, the current “back-and-forth” of assets can provide better opportunities for reallocation. On the other hand, the swing amplitude is also bearable. After the January FOMC and non-agricultural disruptions, the US Treasury's debt issuance plan for the first quarter also fell short of expectations. In addition, we do not expect the January CPI to greatly exceed expectations, and the disturbing factors that may cause interest rate increases are also limited.

1. The pace of this round of interest rate cut transactions: March is too early, May is not too late; the “first half” is more certain than the “second half”
There is still a possibility that the Federal Reserve will start cutting interest rates “early” in the first half of the year. At the FOMC in January, the Federal Reserve stated that the interest rate hike was over, adding that “interest rate cuts are already in sight.” We estimate that January inflation, as disclosed in February, continued to decline. The downward trend in inflation in the first half of the year was quite certain, and overall and core CPI could fall below 3% in the second half of the year. Non-fundamental factors, such as hedging against tight liquidity and avoiding pressure to interfere with elections and treasury bonds, will also have an impact on the Fed's decision. These can all constitute direct or indirect reasons for the Federal Reserve to start a cycle of interest rate cuts. As for the expected high level of noise in January, we don't think it will change direction.

Compared to when it was started, the path variable is larger after opening. As long as interest rate cuts are not postponed until the second half of the year or even the end of the year, we believe that interest rate cuts in March or May will not have a real impact on assets. On the contrary, it is important to note that interest rate cuts are counterproductive to demand and prices; in turn, they will change the path of future interest rate cuts.
Looking at current fundamentals, this round is more like a “preventative” interest rate cut under a soft landing in the economy. The financing costs borne by various departments are not very high, so there is a possibility that demand will recover after a slight adjustment in interest rates, especially real estate. Although the current round of the Federal Reserve's interest rate hike is fast and high, in reality, the increase in financing costs is just suppressing the return on investment, such as the difference between mortgage interest rates and rental returns, and corporate loans and credit bond interest rates and ROIC. Precisely because of this, the economy can be repaired by cutting interest rates only slightly; this in turn makes it unnecessary for the Federal Reserve to cut interest rates drastically in the future. For details,

►Residential real estate: We estimate that the 10-year US Treasury interest rate falls back to 3.5% to 3.8%, and housing sales will rebound. Interest rates on 30-year mortgages are highly correlated with interest rates on 10-year US bonds. We estimate that 3.5% to 3.8% US Treasury interest rates correspond to mortgage interest rates between 6.1% and 6.4%. From the perspective of residents' ability to buy homes, the factors affecting residents' ability to buy homes are mainly housing prices and interest burdens. The year-on-year growth rate of housing prices in the leading year and the year-on-year change in mortgage interest rates fit well with existing home sales.
Based on leading housing price data (the year-on-year growth rate in 2024 ranged from -3% to 4.4%, average value 1.1%), if mortgage interest rates fall back to the above range, existing home sales in the US may increase by an average of 1% in 2024. If interest rates drop even more, such as when interest rates on US bonds fall by 100bp to 3%, housing sales may increase by about 4%. The rebound in real estate sales will drive a rebound in housing prices under tight inventories. Since there is a time lag of about 1 year in the transmission of housing prices to rents, it may lead to a potential end in rent inflation from the end of this year to next year.


►Corporate investment: Expectations are bottoming out, and interest rates may drive a rebound in the overall investment cycle. In the high interest rate environment in 2023, the overall capital expenditure of the US weakened, and industries supported only by fiscal support, such as semiconductors, rebounded sharply. According to the Federal Reserve survey data, recent manufacturing capital expenditure expectations have bottomed out. If interest rates fall later, overall fixed asset investment may bottom out and rebound.

Precisely because the economy may begin to recover after interest rate adjustments, subsequent interest rate cuts will not require much, so the “first half” of early interest rate cuts in market transactions is not a big problem, but excessive linear extrapolation of the “second half” path of interest rate cuts is not recommended. As far as assets are concerned, compared to the expected stage of interest rate cuts and the time window for previous interest rate cuts, the repetition and uncertainty of the main line of subsequent transactions is even higher. After a “turnaround” of assets in January, they are now in a trading window where interest rate cuts are expected to be better allocated.
2. Asset performance before successive interest rate cuts: gold on long-term bonds first, then major US stocks
We reviewed asset performance in six interest rate cut cycles since 1994 (the FOMC announced the federal funds target interest rate for the first time after the meeting), and calculated the frequency and average annualized performance of various types of assets 1 month and 3 months before and after the start of interest rate cuts. Overall, bond and gold trading opportunities are generally better when interest rate cuts are expected, and US stocks are even later in the growth phase.
1) Judging from the frequency of increase, in the 3 months before interest rate cuts, the US Treasury Index (100%), Gold (66.7%), NASDAQ (66.7%), and the S&P 500 Index (66.7%) all achieved positive returns more than 50% in the 6 samples. Industrial metals (0%), the US dollar (16.7%), and crude oil (16.7%) were unable to generate positive returns in most cases. After interest rate cuts, the probability that US stocks (NASDAQ and S&P 500 are still 66.7%) will make positive returns is still greater than 50%. The rise frequency of US bonds and gold has declined, and the dollar has instead exceeded 50%.
2) Judging from the rate of increase, the closer stocks and gold get to cutting interest rates, the higher the increase. In local currency, the Hang Seng Index (average annualized 89.0%), gold (41.1%), MSCI Emerging (34.5%), and NASDAQ (13.1%) had the highest gains in the month before interest rate cuts. The dollar (-18.8%) and crude oil (-43.7%) declined significantly. After the interest rate cut, the increase in gold and US debt was significantly narrower than before the interest rate cut. The S&P 500 (-14.6%) declined significantly within 1 month of cutting interest rates, then improved.


In fact, with the exception of US debt, there was no stable pattern for most assets before and after interest rate cuts. Interest rate cut cycles due to different historical backgrounds and reasons are not the same, so simply relying on historical experience to average doesn't make much sense. In contrast, it is more meaningful to find a stage in history that is more similar to the current background of interest rate cuts and conduct a review.
Comparing the US economy's soft landing, preventive interest rate cuts, and Powell's “hesitant” attitude on interest rate cuts, 2019 is more comparable. In the first half of 2019, US growth momentum slowed. Driven by recessionary expectations, the 3m10s spread continued to narrow and was inverted in May. The rise in equity risk premiums caused US stocks to fall again, forcing the Federal Reserve to cut interest rates in July. However, the transition to interest rate cuts did not go smoothly. Powell said at the July FOMC meeting that there was no clear route for interest rate cuts, but rather decided based more on subsequent data and the evolution of risks, leading to repeated interest rate cut transactions.

Judging from asset performance in 2019, 1) Interest rates on 10-year US bonds declined in anticipation of interest rate cuts. They basically bottomed out soon after the first interest rate cut. Since then, short-term bonds have gradually improved over long-term bonds. 2) Gold rose during the expected period of interest rate cuts. After the interest rate cut, it declined as interest rates rose and continued until the end of the interest rate cut cycle. The US dollar index basically leveled off during the interest rate cut. 3) US stocks fell during the expected phase due to rising equity risk premiums, “forcing” the Federal Reserve to cut interest rates. The first interest rate cut was unclear, and US stocks plummeted again. It was only after cutting interest rates 2 times that they definitely strengthened. 4) Interest rate cuts for crude oil, industrial metals, and agricultural products fell initially, then rebounded after the first rate cut.

3. How to start trading interest rate cuts? It is expected that “back-and-forth” will provide better buying opportunities for bond gold, and wait for twists and turns before buying US stocks
Judging from the number of interest rate cuts currently included in each asset and future space, bonds and gold are more attractive. According to our estimates, as of February 2, interest rate futures implied a 130 bp interest rate cut, followed by US stocks (81 bps). Short-term bonds and gold included relatively few interest rate cuts (38 bp and 32 bps, respectively), while interest rates on long-term bonds have basically returned to the level before the FOMC Powell dovish statement in December.

Judging from the above period of interest rate cuts, especially the experience in 2019, we believe that now is the time to lay out gold for long-term bonds. After cutting interest rates a few times, we can switch to US stocks. Currently, expectations for interest rate cuts included in gold on US bonds have declined markedly, and the allocation window has been opened. After cutting interest rates a few times, due to gradual improvement in growth, subsequent policy paths cannot be extrapolated linearly. At that time, the allocation opportunities for long-term US bonds and gold may gradually decrease after demand improves, and gradually shift to US stocks that switch from the denominator side to the molecular side logic.
►US debt: Short-term suspension but the trend has not changed. At least until the first few interest rate cuts, long-term debt is followed by short-term debt. As long as the direction of interest rate cuts is clear, short-term changes in the timing of interest rate cuts can bring better opportunities for further intervention until growth expectations gradually improve after cutting interest rates a few times. At this time, long-term treasury bonds may gradually bottom out. Based on interest rate expectations (3.6%) and term premiums (0%), the 2024 US Treasury interest rate center will be around 3.5% to 3.8%. Judging from taking into account expectations and the impact of interest rate cuts, from long-term debt first, to switching to short-term debt after cutting interest rates a few times.

►US stocks: The decline in financial liquidity in the second quarter was under some pressure. Focus on the pace of contraction and deceleration and molecular support. On the one hand, the second quarter may face phased pressure, and reverse repurchases may slow down, leading to a contraction in financial liquidity. Our estimates based on liquidity indicators for US stocks were 5-8%, but if the Fed downgrades and decelerates ahead of schedule, it can have a hedging effect. Also, in the early days of interest rate cuts, the market paid more attention to risk and profit pressure, so US bonds and gold are still better at this time. If US stocks can use interest rate cuts to smoothly move from denominator to numerator, and profit pressure is not great, then the excessive process of US stocks is not very deep, and may even switch smoothly. Given the current high valuation, we recommend being patient, but overall we are not pessimistic about US stocks.

► Gold: There is still an opportunity in the early stages of interest rate cuts and before demand improves. A reasonable center is 2,100 US dollars/ounce. Based on our estimates of an actual interest rate of 1% to 1.5% (the nominal interest rate center deducts 2-2.5% inflation expectations), the US dollar index is 102 to 106 US dollars/ounce, and the reasonable center of gold is 2,100 US dollars/ounce, and it still has allocation value. But if a larger increase is needed, it means that the dollar or real interest rate will need to fall more than our benchmark assumptions.
►USD: Remains volatile, at 102 to 106 points. This round of monetary policy easing is unique. Its significance is that it is not easing caused by the US recession, but more likely comes from preventive interest rate cuts. This also means that monetary policy is not a reason for the weakening of the US dollar. Taking 2019 as an example, China's growth slowed and was constrained by macro leverage levels. Overall stimulus was weak, and economic recovery was slow. The US dollar index is still strong even after interest rate cuts began, indicating that the trending inflection point of the US dollar depends on the expansion rate of non-US economies.

January review: The economy is still resilient, expectations of interest rate cuts in March are being suppressed, leading technology leaders in US stocks
Economic growth is still resilient, and expectations of interest rate cuts in March have been weakened. Major economic data this month, including CPI, retail, fourth-quarter GDP, and non-agricultural agriculture, all rose above expectations, indicating that the US economy is still resilient, suppressing expectations of interest rate cuts. The FOMC Federal Reserve's statement in January once again “threw cold water” on the March interest rate cut, saying “the March interest rate cut is not a benchmark situation” [1], preventing the market from thinking too much, but it did not completely rule out the possibility of early interest rate cuts. Non-farm payrolls data at the end of the month further strengthened this view, driving interest rates on US bonds back to 4%. The US earnings season kicks off this month. Although financial reports from Microsoft and Google fell short of the market's unanimous expectations, Meta's fourth quarter results and first-quarter guidance both exceeded market expectations, supporting the performance of leading technology stocks.
Overall, January, 1) Cross-asset: bulk > equity > debt;
2) Equity market: developed markets rose while emerging markets fell; in the developed world, Japan led the way and the UK fell; in emerging markets, Russia rose, and the Korean stock market and A/H stocks fell;
3) Bond market: There is little change in the overall rise and fall rate of the bond market;
4) Exchange rate: the US dollar strengthened, and the Japanese yen and Australian dollar weakened;
5) Commodities: Crude oil rose, natural gas and soybeans led the decline. In January, the US, Eurozone, and China economic accident indices declined, and Japan's economic accident index rose; financial conditions in the Eurozone and Japan relaxed, and financial conditions in the US and China tightened. In terms of capital flows, inflows to emerging markets and China have accelerated; inflows from the US have slowed; inflows from Japan have switched; outflows from developed Europe have slowed; inflows of bond funds have accelerated, and inflows of equity funds and money market funds have slowed.
In January, the overseas asset allocation portfolio rose 0.7% (in local currency); leading the global stock market (0.60%, MSCI global index, dollar denominated) and global bond market (-1.29%, Bank of America Merrill Lynch Global Bond Index, dollar denominated), but lagging behind commodities (3.63%, S&P Goldman Sachs commodity index, dollar denominated). Looking at the breakdown, VIX, US stocks, etc. contributed significantly, with emerging markets being the main drag. Since its inception in July 2016, the portfolio has accumulated a return of 118.2%, with a Sharpe ratio of 2.1%.


[1] https://www.federalreserve.gov/monetarypolicy/fomcpresconf20240131.htm
Editor/Somer