
Shandong Swan CottonIndustrial Machinery Stock Co.,Ltd. (SHSE:603029) shares have had a horrible month, losing 28% after a relatively good period beforehand. The drop over the last 30 days has capped off a tough year for shareholders, with the share price down 41% in that time.
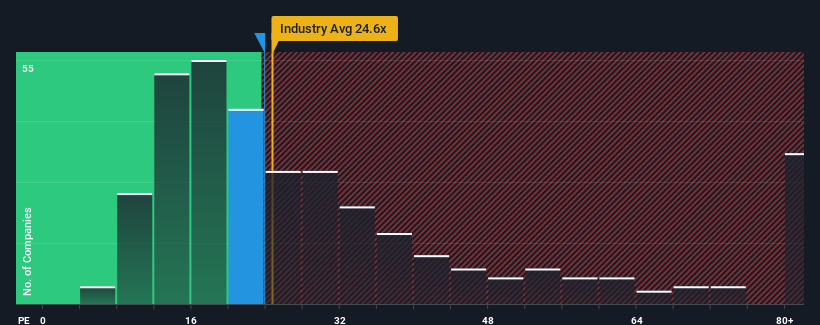
Although its price has dipped substantially, it's still not a stretch to say that Shandong Swan CottonIndustrial Machinery StockLtd's price-to-earnings (or "P/E") ratio of 23.9x right now seems quite "middle-of-the-road" compared to the market in China, where the median P/E ratio is around 26x. Although, it's not wise to simply ignore the P/E without explanation as investors may be disregarding a distinct opportunity or a costly mistake.
Shandong Swan CottonIndustrial Machinery StockLtd certainly has been doing a great job lately as it's been growing earnings at a really rapid pace. The P/E is probably moderate because investors think this strong earnings growth might not be enough to outperform the broader market in the near future. If you like the company, you'd be hoping this isn't the case so that you could potentially pick up some stock while it's not quite in favour.
What Are Growth Metrics Telling Us About The P/E?
There's an inherent assumption that a company should be matching the market for P/E ratios like Shandong Swan CottonIndustrial Machinery StockLtd's to be considered reasonable.
If we review the last year of earnings growth, the company posted a terrific increase of 107%. Pleasingly, EPS has also lifted 2,117% in aggregate from three years ago, thanks to the last 12 months of growth. Accordingly, shareholders would have probably welcomed those medium-term rates of earnings growth.
Comparing that to the market, which is only predicted to deliver 42% growth in the next 12 months, the company's momentum is stronger based on recent medium-term annualised earnings results.
With this information, we find it interesting that Shandong Swan CottonIndustrial Machinery StockLtd is trading at a fairly similar P/E to the market. It may be that most investors are not convinced the company can maintain its recent growth rates.
The Key Takeaway
With its share price falling into a hole, the P/E for Shandong Swan CottonIndustrial Machinery StockLtd looks quite average now. Using the price-to-earnings ratio alone to determine if you should sell your stock isn't sensible, however it can be a practical guide to the company's future prospects.
Our examination of Shandong Swan CottonIndustrial Machinery StockLtd revealed its three-year earnings trends aren't contributing to its P/E as much as we would have predicted, given they look better than current market expectations. When we see strong earnings with faster-than-market growth, we assume potential risks are what might be placing pressure on the P/E ratio. It appears some are indeed anticipating earnings instability, because the persistence of these recent medium-term conditions would normally provide a boost to the share price.
You should always think about risks. Case in point, we've spotted 3 warning signs for Shandong Swan CottonIndustrial Machinery StockLtd you should be aware of.
It's important to make sure you look for a great company, not just the first idea you come across. So take a peek at this free list of interesting companies with strong recent earnings growth (and a low P/E).
Have feedback on this article? Concerned about the content? Get in touch with us directly. Alternatively, email editorial-team (at) simplywallst.com.
This article by Simply Wall St is general in nature. We provide commentary based on historical data and analyst forecasts only using an unbiased methodology and our articles are not intended to be financial advice. It does not constitute a recommendation to buy or sell any stock, and does not take account of your objectives, or your financial situation. We aim to bring you long-term focused analysis driven by fundamental data. Note that our analysis may not factor in the latest price-sensitive company announcements or qualitative material. Simply Wall St has no position in any stocks mentioned.