
Beijing Wandong Medical Technology Co.,Ltd. (SHSE:600055) shareholders that were waiting for something to happen have been dealt a blow with a 30% share price drop in the last month. The drop over the last 30 days has capped off a tough year for shareholders, with the share price down 43% in that time.
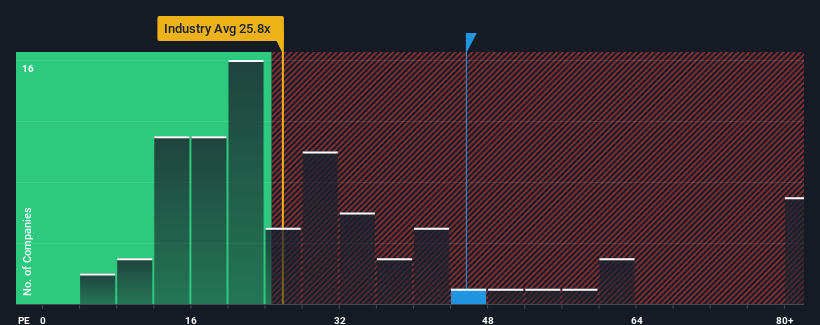
Although its price has dipped substantially, Beijing Wandong Medical TechnologyLtd's price-to-earnings (or "P/E") ratio of 45.6x might still make it look like a strong sell right now compared to the market in China, where around half of the companies have P/E ratios below 27x and even P/E's below 17x are quite common. However, the P/E might be quite high for a reason and it requires further investigation to determine if it's justified.
For example, consider that Beijing Wandong Medical TechnologyLtd's financial performance has been pretty ordinary lately as earnings growth is non-existent. One possibility is that the P/E is high because investors think the benign earnings growth will improve to outperform the broader market in the near future. You'd really hope so, otherwise you're paying a pretty hefty price for no particular reason.
How Is Beijing Wandong Medical TechnologyLtd's Growth Trending?
Beijing Wandong Medical TechnologyLtd's P/E ratio would be typical for a company that's expected to deliver very strong growth, and importantly, perform much better than the market.
Taking a look back first, we see that there was hardly any earnings per share growth to speak of for the company over the past year. Whilst it's an improvement, it wasn't enough to get the company out of the hole it was in, with earnings down 34% overall from three years ago. Therefore, it's fair to say the earnings growth recently has been undesirable for the company.
Comparing that to the market, which is predicted to deliver 41% growth in the next 12 months, the company's downward momentum based on recent medium-term earnings results is a sobering picture.
In light of this, it's alarming that Beijing Wandong Medical TechnologyLtd's P/E sits above the majority of other companies. Apparently many investors in the company are way more bullish than recent times would indicate and aren't willing to let go of their stock at any price. Only the boldest would assume these prices are sustainable as a continuation of recent earnings trends is likely to weigh heavily on the share price eventually.
The Bottom Line On Beijing Wandong Medical TechnologyLtd's P/E
Even after such a strong price drop, Beijing Wandong Medical TechnologyLtd's P/E still exceeds the rest of the market significantly. It's argued the price-to-earnings ratio is an inferior measure of value within certain industries, but it can be a powerful business sentiment indicator.
We've established that Beijing Wandong Medical TechnologyLtd currently trades on a much higher than expected P/E since its recent earnings have been in decline over the medium-term. Right now we are increasingly uncomfortable with the high P/E as this earnings performance is highly unlikely to support such positive sentiment for long. Unless the recent medium-term conditions improve markedly, it's very challenging to accept these prices as being reasonable.
You always need to take note of risks, for example - Beijing Wandong Medical TechnologyLtd has 1 warning sign we think you should be aware of.
It's important to make sure you look for a great company, not just the first idea you come across. So take a peek at this free list of interesting companies with strong recent earnings growth (and a low P/E).
Have feedback on this article? Concerned about the content? Get in touch with us directly. Alternatively, email editorial-team (at) simplywallst.com.
This article by Simply Wall St is general in nature. We provide commentary based on historical data and analyst forecasts only using an unbiased methodology and our articles are not intended to be financial advice. It does not constitute a recommendation to buy or sell any stock, and does not take account of your objectives, or your financial situation. We aim to bring you long-term focused analysis driven by fundamental data. Note that our analysis may not factor in the latest price-sensitive company announcements or qualitative material. Simply Wall St has no position in any stocks mentioned.