
The Xinjiang Youhao(Group)Co.,Ltd (SHSE:600778) share price has fared very poorly over the last month, falling by a substantial 26%. The drop over the last 30 days has capped off a tough year for shareholders, with the share price down 24% in that time.
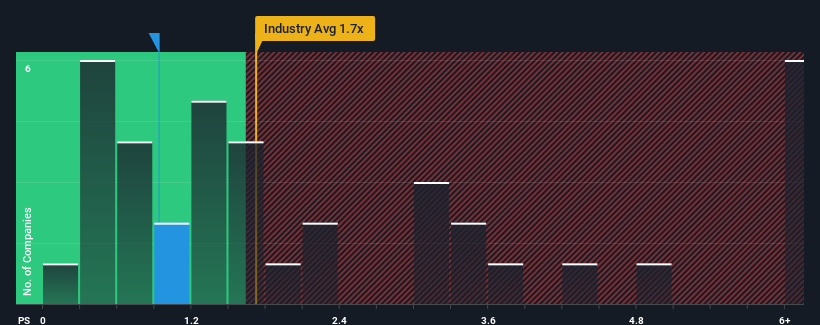
After such a large drop in price, Xinjiang Youhao(Group)Co.Ltd may be sending buy signals at present with its price-to-sales (or "P/S") ratio of 0.9x, considering almost half of all companies in the Multiline Retail industry in China have P/S ratios greater than 1.7x and even P/S higher than 4x aren't out of the ordinary. However, the P/S might be low for a reason and it requires further investigation to determine if it's justified.
How Has Xinjiang Youhao(Group)Co.Ltd Performed Recently?
For example, consider that Xinjiang Youhao(Group)Co.Ltd's financial performance has been poor lately as its revenue has been in decline. It might be that many expect the disappointing revenue performance to continue or accelerate, which has repressed the P/S. If you like the company, you'd be hoping this isn't the case so that you could potentially pick up some stock while it's out of favour.
We don't have analyst forecasts, but you can see how recent trends are setting up the company for the future by checking out our free report on Xinjiang Youhao(Group)Co.Ltd's earnings, revenue and cash flow.Do Revenue Forecasts Match The Low P/S Ratio?
There's an inherent assumption that a company should underperform the industry for P/S ratios like Xinjiang Youhao(Group)Co.Ltd's to be considered reasonable.
Taking a look back first, the company's revenue growth last year wasn't something to get excited about as it posted a disappointing decline of 8.1%. This means it has also seen a slide in revenue over the longer-term as revenue is down 45% in total over the last three years. Therefore, it's fair to say the revenue growth recently has been undesirable for the company.
Comparing that to the industry, which is predicted to deliver 73% growth in the next 12 months, the company's downward momentum based on recent medium-term revenue results is a sobering picture.
With this information, we are not surprised that Xinjiang Youhao(Group)Co.Ltd is trading at a P/S lower than the industry. However, we think shrinking revenues are unlikely to lead to a stable P/S over the longer term, which could set up shareholders for future disappointment. There's potential for the P/S to fall to even lower levels if the company doesn't improve its top-line growth.
The Key Takeaway
Xinjiang Youhao(Group)Co.Ltd's P/S has taken a dip along with its share price. Typically, we'd caution against reading too much into price-to-sales ratios when settling on investment decisions, though it can reveal plenty about what other market participants think about the company.
Our examination of Xinjiang Youhao(Group)Co.Ltd confirms that the company's shrinking revenue over the past medium-term is a key factor in its low price-to-sales ratio, given the industry is projected to grow. At this stage investors feel the potential for an improvement in revenue isn't great enough to justify a higher P/S ratio. If recent medium-term revenue trends continue, it's hard to see the share price moving strongly in either direction in the near future under these circumstances.
Before you settle on your opinion, we've discovered 1 warning sign for Xinjiang Youhao(Group)Co.Ltd that you should be aware of.
If these risks are making you reconsider your opinion on Xinjiang Youhao(Group)Co.Ltd, explore our interactive list of high quality stocks to get an idea of what else is out there.
Have feedback on this article? Concerned about the content? Get in touch with us directly. Alternatively, email editorial-team (at) simplywallst.com.
This article by Simply Wall St is general in nature. We provide commentary based on historical data and analyst forecasts only using an unbiased methodology and our articles are not intended to be financial advice. It does not constitute a recommendation to buy or sell any stock, and does not take account of your objectives, or your financial situation. We aim to bring you long-term focused analysis driven by fundamental data. Note that our analysis may not factor in the latest price-sensitive company announcements or qualitative material. Simply Wall St has no position in any stocks mentioned.