
Beijing Jingpin Tezhuang Technology Co.,Ltd. (SHSE:688084) shareholders won't be pleased to see that the share price has had a very rough month, dropping 28% and undoing the prior period's positive performance. The drop over the last 30 days has capped off a tough year for shareholders, with the share price down 44% in that time.
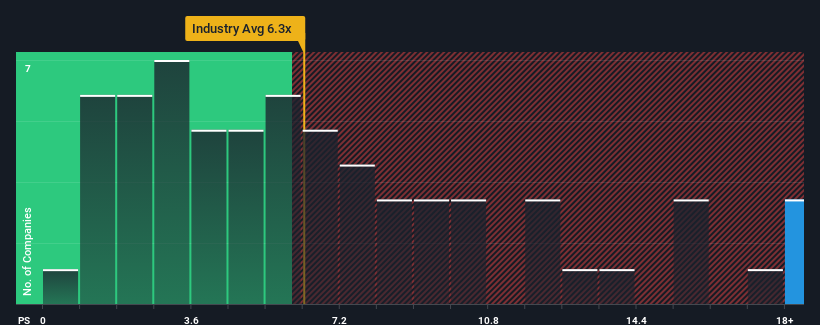
Although its price has dipped substantially, Beijing Jingpin Tezhuang TechnologyLtd may still be sending very bearish signals at the moment with a price-to-sales (or "P/S") ratio of 20.8x, since almost half of all companies in the Aerospace & Defense industry in China have P/S ratios under 6.3x and even P/S lower than 3x are not unusual. However, the P/S might be quite high for a reason and it requires further investigation to determine if it's justified.
How Beijing Jingpin Tezhuang TechnologyLtd Has Been Performing
While the industry has experienced revenue growth lately, Beijing Jingpin Tezhuang TechnologyLtd's revenue has gone into reverse gear, which is not great. Perhaps the market is expecting the poor revenue to reverse, justifying it's current high P/S.. You'd really hope so, otherwise you're paying a pretty hefty price for no particular reason.
If you'd like to see what analysts are forecasting going forward, you should check out our free report on Beijing Jingpin Tezhuang TechnologyLtd.What Are Revenue Growth Metrics Telling Us About The High P/S?
Beijing Jingpin Tezhuang TechnologyLtd's P/S ratio would be typical for a company that's expected to deliver very strong growth, and importantly, perform much better than the industry.
In reviewing the last year of financials, we were disheartened to see the company's revenues fell to the tune of 54%. The last three years don't look nice either as the company has shrunk revenue by 35% in aggregate. So unfortunately, we have to acknowledge that the company has not done a great job of growing revenue over that time.
Shifting to the future, estimates from the two analysts covering the company suggest revenue should grow by 202% over the next year. That's shaping up to be materially higher than the 48% growth forecast for the broader industry.
With this information, we can see why Beijing Jingpin Tezhuang TechnologyLtd is trading at such a high P/S compared to the industry. It seems most investors are expecting this strong future growth and are willing to pay more for the stock.
The Bottom Line On Beijing Jingpin Tezhuang TechnologyLtd's P/S
A significant share price dive has done very little to deflate Beijing Jingpin Tezhuang TechnologyLtd's very lofty P/S. We'd say the price-to-sales ratio's power isn't primarily as a valuation instrument but rather to gauge current investor sentiment and future expectations.
As we suspected, our examination of Beijing Jingpin Tezhuang TechnologyLtd's analyst forecasts revealed that its superior revenue outlook is contributing to its high P/S. At this stage investors feel the potential for a deterioration in revenues is quite remote, justifying the elevated P/S ratio. Unless these conditions change, they will continue to provide strong support to the share price.
And what about other risks? Every company has them, and we've spotted 3 warning signs for Beijing Jingpin Tezhuang TechnologyLtd you should know about.
Of course, profitable companies with a history of great earnings growth are generally safer bets. So you may wish to see this free collection of other companies that have reasonable P/E ratios and have grown earnings strongly.
Have feedback on this article? Concerned about the content? Get in touch with us directly. Alternatively, email editorial-team (at) simplywallst.com.
This article by Simply Wall St is general in nature. We provide commentary based on historical data and analyst forecasts only using an unbiased methodology and our articles are not intended to be financial advice. It does not constitute a recommendation to buy or sell any stock, and does not take account of your objectives, or your financial situation. We aim to bring you long-term focused analysis driven by fundamental data. Note that our analysis may not factor in the latest price-sensitive company announcements or qualitative material. Simply Wall St has no position in any stocks mentioned.