
AVE Science&Technology CO.,LTD (SHSE:688067) shareholders that were waiting for something to happen have been dealt a blow with a 26% share price drop in the last month. The drop over the last 30 days has capped off a tough year for shareholders, with the share price down 15% in that time.
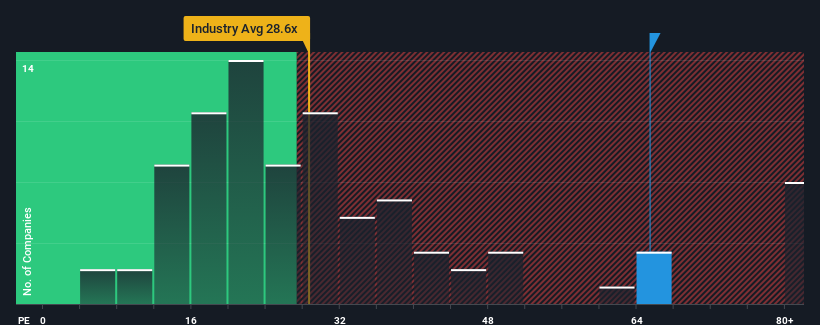
In spite of the heavy fall in price, AVE Science&TechnologyLTD's price-to-earnings (or "P/E") ratio of 65.4x might still make it look like a strong sell right now compared to the market in China, where around half of the companies have P/E ratios below 29x and even P/E's below 18x are quite common. Although, it's not wise to just take the P/E at face value as there may be an explanation why it's so lofty.
As an illustration, earnings have deteriorated at AVE Science&TechnologyLTD over the last year, which is not ideal at all. One possibility is that the P/E is high because investors think the company will still do enough to outperform the broader market in the near future. If not, then existing shareholders may be quite nervous about the viability of the share price.
View our latest analysis for AVE Science&TechnologyLTD
Is There Enough Growth For AVE Science&TechnologyLTD?
AVE Science&TechnologyLTD's P/E ratio would be typical for a company that's expected to deliver very strong growth, and importantly, perform much better than the market.
If we review the last year of earnings, dishearteningly the company's profits fell to the tune of 36%. As a result, earnings from three years ago have also fallen 65% overall. Therefore, it's fair to say the earnings growth recently has been undesirable for the company.
Comparing that to the market, which is predicted to deliver 42% growth in the next 12 months, the company's downward momentum based on recent medium-term earnings results is a sobering picture.
With this information, we find it concerning that AVE Science&TechnologyLTD is trading at a P/E higher than the market. Apparently many investors in the company are way more bullish than recent times would indicate and aren't willing to let go of their stock at any price. There's a very good chance existing shareholders are setting themselves up for future disappointment if the P/E falls to levels more in line with the recent negative growth rates.
The Bottom Line On AVE Science&TechnologyLTD's P/E
A significant share price dive has done very little to deflate AVE Science&TechnologyLTD's very lofty P/E. Generally, our preference is to limit the use of the price-to-earnings ratio to establishing what the market thinks about the overall health of a company.
We've established that AVE Science&TechnologyLTD currently trades on a much higher than expected P/E since its recent earnings have been in decline over the medium-term. Right now we are increasingly uncomfortable with the high P/E as this earnings performance is highly unlikely to support such positive sentiment for long. Unless the recent medium-term conditions improve markedly, it's very challenging to accept these prices as being reasonable.
And what about other risks? Every company has them, and we've spotted 3 warning signs for AVE Science&TechnologyLTD (of which 1 can't be ignored!) you should know about.
Of course, you might also be able to find a better stock than AVE Science&TechnologyLTD. So you may wish to see this free collection of other companies that have reasonable P/E ratios and have grown earnings strongly.
Have feedback on this article? Concerned about the content? Get in touch with us directly. Alternatively, email editorial-team (at) simplywallst.com.
This article by Simply Wall St is general in nature. We provide commentary based on historical data and analyst forecasts only using an unbiased methodology and our articles are not intended to be financial advice. It does not constitute a recommendation to buy or sell any stock, and does not take account of your objectives, or your financial situation. We aim to bring you long-term focused analysis driven by fundamental data. Note that our analysis may not factor in the latest price-sensitive company announcements or qualitative material. Simply Wall St has no position in any stocks mentioned.