
The main aim of stock picking is to find the market-beating stocks. But the main game is to find enough winners to more than offset the losers At this point some shareholders may be questioning their investment in Zhejiang Jiahua Energy Chemical Industry Co.,Ltd. (SHSE:600273), since the last five years saw the share price fall 16%. More recently, the share price has dropped a further 13% in a month. We do note, however, that the broader market is down 11% in that period, and this may have weighed on the share price.
With the stock having lost 3.5% in the past week, it's worth taking a look at business performance and seeing if there's any red flags.
Check out our latest analysis for Zhejiang Jiahua Energy Chemical IndustryLtd
In his essay The Superinvestors of Graham-and-Doddsville Warren Buffett described how share prices do not always rationally reflect the value of a business. One flawed but reasonable way to assess how sentiment around a company has changed is to compare the earnings per share (EPS) with the share price.
While the share price declined over five years, Zhejiang Jiahua Energy Chemical IndustryLtd actually managed to increase EPS by an average of 3.0% per year. So it doesn't seem like EPS is a great guide to understanding how the market is valuing the stock. Or possibly, the market was previously very optimistic, so the stock has disappointed, despite improving EPS.
Given that EPS has increased, but the share price has fallen, it's fair to say that market sentiment around the stock has become more negative. That said, if EPS continues to increase, it seems very likely the share price will get a boost, in the long term.
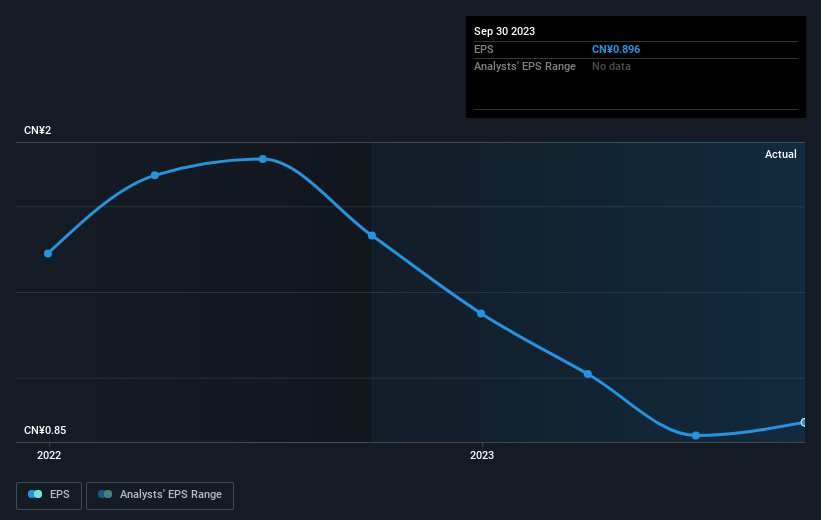
You can see below how EPS has changed over time (discover the exact values by clicking on the image).
It might be well worthwhile taking a look at our free report on Zhejiang Jiahua Energy Chemical IndustryLtd's earnings, revenue and cash flow.
What About Dividends?
As well as measuring the share price return, investors should also consider the total shareholder return (TSR). The TSR incorporates the value of any spin-offs or discounted capital raisings, along with any dividends, based on the assumption that the dividends are reinvested. So for companies that pay a generous dividend, the TSR is often a lot higher than the share price return. In the case of Zhejiang Jiahua Energy Chemical IndustryLtd, it has a TSR of 6.3% for the last 5 years. That exceeds its share price return that we previously mentioned. This is largely a result of its dividend payments!
A Different Perspective
While it's certainly disappointing to see that Zhejiang Jiahua Energy Chemical IndustryLtd shares lost 8.6% throughout the year, that wasn't as bad as the market loss of 21%. Longer term investors wouldn't be so upset, since they would have made 1.2%, each year, over five years. In the best case scenario the last year is just a temporary blip on the journey to a brighter future. While it is well worth considering the different impacts that market conditions can have on the share price, there are other factors that are even more important. Consider for instance, the ever-present spectre of investment risk. We've identified 1 warning sign with Zhejiang Jiahua Energy Chemical IndustryLtd , and understanding them should be part of your investment process.
For those who like to find winning investments this free list of growing companies with recent insider purchasing, could be just the ticket.
Please note, the market returns quoted in this article reflect the market weighted average returns of stocks that currently trade on Chinese exchanges.
Have feedback on this article? Concerned about the content? Get in touch with us directly. Alternatively, email editorial-team (at) simplywallst.com.
This article by Simply Wall St is general in nature. We provide commentary based on historical data and analyst forecasts only using an unbiased methodology and our articles are not intended to be financial advice. It does not constitute a recommendation to buy or sell any stock, and does not take account of your objectives, or your financial situation. We aim to bring you long-term focused analysis driven by fundamental data. Note that our analysis may not factor in the latest price-sensitive company announcements or qualitative material. Simply Wall St has no position in any stocks mentioned.