
Shandong Huapeng Glass Co.,Ltd. (SHSE:603021) shareholders won't be pleased to see that the share price has had a very rough month, dropping 30% and undoing the prior period's positive performance. The drop over the last 30 days has capped off a tough year for shareholders, with the share price down 30% in that time.
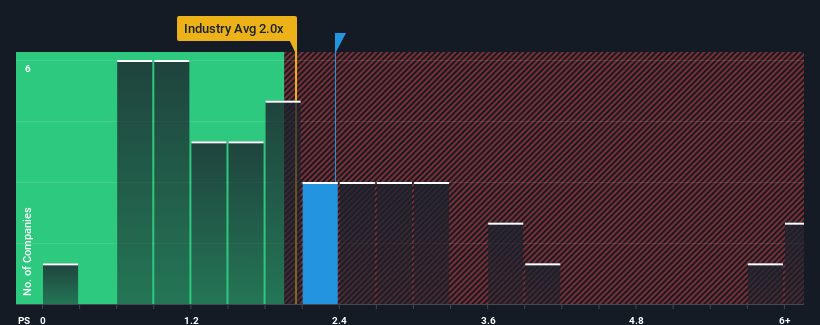
Although its price has dipped substantially, it's still not a stretch to say that Shandong Huapeng GlassLtd's price-to-sales (or "P/S") ratio of 2.4x right now seems quite "middle-of-the-road" compared to the Packaging industry in China, where the median P/S ratio is around 2x. While this might not raise any eyebrows, if the P/S ratio is not justified investors could be missing out on a potential opportunity or ignoring looming disappointment.
See our latest analysis for Shandong Huapeng GlassLtd
What Does Shandong Huapeng GlassLtd's P/S Mean For Shareholders?
As an illustration, revenue has deteriorated at Shandong Huapeng GlassLtd over the last year, which is not ideal at all. Perhaps investors believe the recent revenue performance is enough to keep in line with the industry, which is keeping the P/S from dropping off. If you like the company, you'd at least be hoping this is the case so that you could potentially pick up some stock while it's not quite in favour.
We don't have analyst forecasts, but you can see how recent trends are setting up the company for the future by checking out our free report on Shandong Huapeng GlassLtd's earnings, revenue and cash flow.Is There Some Revenue Growth Forecasted For Shandong Huapeng GlassLtd?
In order to justify its P/S ratio, Shandong Huapeng GlassLtd would need to produce growth that's similar to the industry.
In reviewing the last year of financials, we were disheartened to see the company's revenues fell to the tune of 14%. The last three years don't look nice either as the company has shrunk revenue by 34% in aggregate. Therefore, it's fair to say the revenue growth recently has been undesirable for the company.
Comparing that to the industry, which is predicted to deliver 23% growth in the next 12 months, the company's downward momentum based on recent medium-term revenue results is a sobering picture.
With this in mind, we find it worrying that Shandong Huapeng GlassLtd's P/S exceeds that of its industry peers. Apparently many investors in the company are way less bearish than recent times would indicate and aren't willing to let go of their stock right now. There's a good chance existing shareholders are setting themselves up for future disappointment if the P/S falls to levels more in line with the recent negative growth rates.
The Key Takeaway
With its share price dropping off a cliff, the P/S for Shandong Huapeng GlassLtd looks to be in line with the rest of the Packaging industry. Typically, we'd caution against reading too much into price-to-sales ratios when settling on investment decisions, though it can reveal plenty about what other market participants think about the company.
The fact that Shandong Huapeng GlassLtd currently trades at a P/S on par with the rest of the industry is surprising to us since its recent revenues have been in decline over the medium-term, all while the industry is set to grow. Even though it matches the industry, we're uncomfortable with the current P/S ratio, as this dismal revenue performance is unlikely to support a more positive sentiment for long. Unless the recent medium-term conditions improve markedly, investors will have a hard time accepting the share price as fair value.
Before you take the next step, you should know about the 2 warning signs for Shandong Huapeng GlassLtd that we have uncovered.
It's important to make sure you look for a great company, not just the first idea you come across. So if growing profitability aligns with your idea of a great company, take a peek at this free list of interesting companies with strong recent earnings growth (and a low P/E).
Have feedback on this article? Concerned about the content? Get in touch with us directly. Alternatively, email editorial-team (at) simplywallst.com.
This article by Simply Wall St is general in nature. We provide commentary based on historical data and analyst forecasts only using an unbiased methodology and our articles are not intended to be financial advice. It does not constitute a recommendation to buy or sell any stock, and does not take account of your objectives, or your financial situation. We aim to bring you long-term focused analysis driven by fundamental data. Note that our analysis may not factor in the latest price-sensitive company announcements or qualitative material. Simply Wall St has no position in any stocks mentioned.