
The Total Return for UMS Holdings (SGX:558) Investors Has Risen Faster Than Earnings Growth Over the Last Five Years
The Total Return for UMS Holdings (SGX:558) Investors Has Risen Faster Than Earnings Growth Over the Last Five Years
When you buy a stock there is always a possibility that it could drop 100%. But when you pick a company that is really flourishing, you can make more than 100%. For instance, the price of UMS Holdings Limited (SGX:558) stock is up an impressive 152% over the last five years. Unfortunately, though, the stock has dropped 7.2% over a week.
當你買入股票時,它總是有可能下跌100%。但是,當你選擇一家真正蓬勃發展的公司時,你可以 使 超過 100%。例如,UMS控股有限公司(新加坡證券交易所股票代碼:558)的股票價格在過去五年中上漲了令人印象深刻的152%。但不幸的是,該股在一週內下跌了7.2%。
While this past week has detracted from the company's five-year return, let's look at the recent trends of the underlying business and see if the gains have been in alignment.
儘管過去一週減損了該公司的五年回報率,但讓我們來看看基礎業務的最新趨勢,看看漲幅是否一致。
Check out our latest analysis for UMS Holdings
查看我們對UMS Holdings的最新分析
In his essay The Superinvestors of Graham-and-Doddsville Warren Buffett described how share prices do not always rationally reflect the value of a business. One imperfect but simple way to consider how the market perception of a company has shifted is to compare the change in the earnings per share (EPS) with the share price movement.
在他的文章中 格雷厄姆和多茲維爾的超級投資者 禾倫·巴菲特描述了股價如何並不總是合理地反映企業的價值。考慮市場對公司的看法發生了怎樣的變化的一種不完美但簡單的方法是將每股收益(EPS)的變化與股價走勢進行比較。
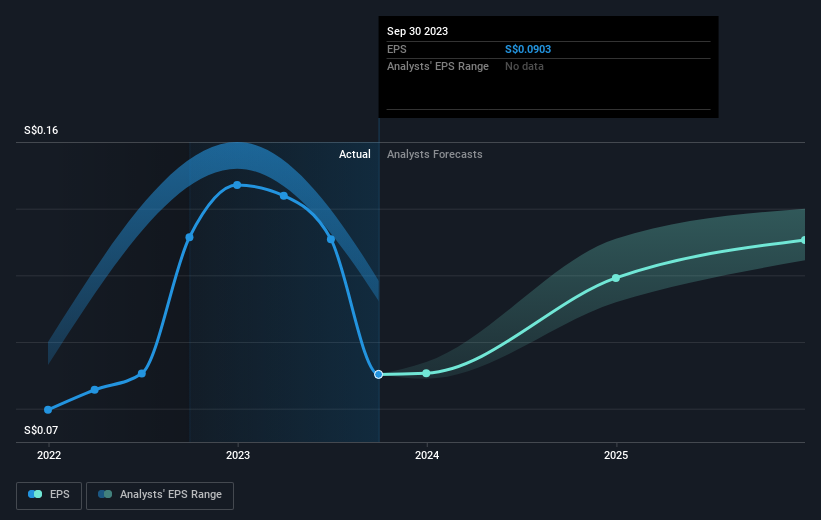
During five years of share price growth, UMS Holdings achieved compound earnings per share (EPS) growth of 4.2% per year. This EPS growth is lower than the 20% average annual increase in the share price. This suggests that market participants hold the company in higher regard, these days. And that's hardly shocking given the track record of growth.
在五年的股價增長中,UMS Holdings實現了每年4.2%的複合每股收益(EPS)增長。每股收益的增長低於股價年均增長20%。這表明,如今,市場參與者對公司的重視程度更高。考慮到增長記錄,這並不令人震驚。
You can see below how EPS has changed over time (discover the exact values by clicking on the image).
你可以在下面看到 EPS 是如何隨着時間的推移而變化的(點擊圖片發現確切的值)。
Dive deeper into UMS Holdings' key metrics by checking this interactive graph of UMS Holdings's earnings, revenue and cash flow.
查看這張UMS Holdings收益、收入和現金流的交互式圖表,深入了解UMS Holdings的關鍵指標。
What About Dividends?
分紅呢?
As well as measuring the share price return, investors should also consider the total shareholder return (TSR). The TSR is a return calculation that accounts for the value of cash dividends (assuming that any dividend received was reinvested) and the calculated value of any discounted capital raisings and spin-offs. It's fair to say that the TSR gives a more complete picture for stocks that pay a dividend. We note that for UMS Holdings the TSR over the last 5 years was 213%, which is better than the share price return mentioned above. And there's no prize for guessing that the dividend payments largely explain the divergence!
除了衡量股價回報率外,投資者還應考慮股東總回報率(TSR)。股東總回報率是一種回報計算方法,它考慮了現金分紅的價值(假設收到的任何股息都經過再投資)以及任何貼現資本籌集和分拆的計算價值。可以公平地說,股東總回報率爲支付股息的股票提供了更完整的畫面。我們注意到,對於UMS Holdings而言,過去5年的股東總回報率爲213%,好於上述股價回報率。而且,猜測股息支付在很大程度上解釋了這種分歧是沒有好處的!
A Different Perspective
不同的視角
We're pleased to report that UMS Holdings shareholders have received a total shareholder return of 3.3% over one year. And that does include the dividend. However, the TSR over five years, coming in at 26% per year, is even more impressive. The pessimistic view would be that be that the stock has its best days behind it, but on the other hand the price might simply be moderating while the business itself continues to execute. While it is well worth considering the different impacts that market conditions can have on the share price, there are other factors that are even more important. Consider for instance, the ever-present spectre of investment risk. We've identified 1 warning sign with UMS Holdings , and understanding them should be part of your investment process.
我們很高興地向大家報告,UMS Holdings的股東在一年內獲得了3.3%的總股東回報率。這確實包括股息。但是,五年內的股東總回報率爲每年26%,更加令人印象深刻。悲觀的觀點是,該股已經過了最好的時期,但另一方面,在業務本身繼續執行的同時,價格可能只是在放緩。儘管市場狀況可能對股價產生的不同影響值得考慮,但還有其他因素更爲重要。例如,投資風險的幽靈無處不在。我們已經向UMS Holdings發現了一個警告信號,了解它們應該是您投資過程的一部分。
We will like UMS Holdings better if we see some big insider buys. While we wait, check out this free list of growing companies with considerable, recent, insider buying.
如果我們看到一些大規模的內幕收購,我們會更喜歡UMS Holdings。在我們等待的同時,請查看這份免費清單,列出了最近有大量內幕收購的成長型公司。
Please note, the market returns quoted in this article reflect the market weighted average returns of stocks that currently trade on Singaporean exchanges.
請注意,本文引用的市場回報反映了目前在新加坡交易所交易的股票的市場加權平均回報。
Have feedback on this article? Concerned about the content? Get in touch with us directly. Alternatively, email editorial-team (at) simplywallst.com.
This article by Simply Wall St is general in nature. We provide commentary based on historical data and analyst forecasts only using an unbiased methodology and our articles are not intended to be financial advice. It does not constitute a recommendation to buy or sell any stock, and does not take account of your objectives, or your financial situation. We aim to bring you long-term focused analysis driven by fundamental data. Note that our analysis may not factor in the latest price-sensitive company announcements or qualitative material. Simply Wall St has no position in any stocks mentioned.
對這篇文章有反饋嗎?對內容感到擔憂?直接聯繫我們。 或者,給編輯團隊 (at) simplywallst.com 發送電子郵件。
Simply Wall St的這篇文章本質上是籠統的。我們僅使用公正的方法根據歷史數據和分析師的預測提供評論,我們的文章無意作爲財務建議。它不構成買入或賣出任何股票的建議,也沒有考慮到您的目標或財務狀況。我們的目標是爲您提供由基本數據驅動的長期重點分析。請注意,我們的分析可能不考慮最新的價格敏感型公司公告或定性材料。簡而言之,華爾街沒有持有任何上述股票的頭寸。
譯文內容由第三人軟體翻譯。