
The Hangzhou Hopechart IoT Technology Co.,Ltd (SHSE:688288) share price has fared very poorly over the last month, falling by a substantial 27%. Longer-term shareholders would now have taken a real hit with the stock declining 7.4% in the last year.
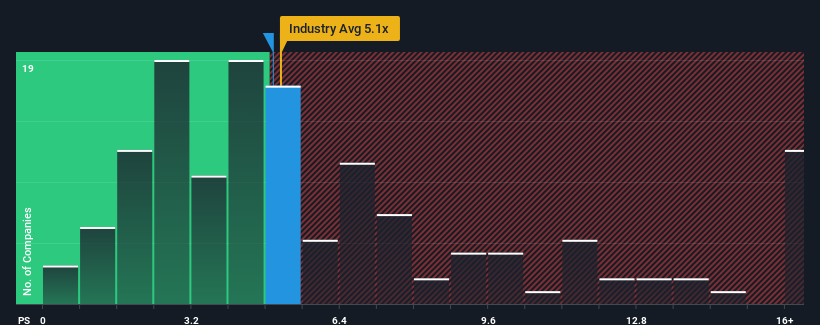
In spite of the heavy fall in price, there still wouldn't be many who think Hangzhou Hopechart IoT TechnologyLtd's price-to-sales (or "P/S") ratio of 5x is worth a mention when the median P/S in China's Software industry is similar at about 5.1x. While this might not raise any eyebrows, if the P/S ratio is not justified investors could be missing out on a potential opportunity or ignoring looming disappointment.
See our latest analysis for Hangzhou Hopechart IoT TechnologyLtd
How Has Hangzhou Hopechart IoT TechnologyLtd Performed Recently?
With revenue growth that's exceedingly strong of late, Hangzhou Hopechart IoT TechnologyLtd has been doing very well. The P/S is probably moderate because investors think this strong revenue growth might not be enough to outperform the broader industry in the near future. If you like the company, you'd be hoping this isn't the case so that you could potentially pick up some stock while it's not quite in favour.
Although there are no analyst estimates available for Hangzhou Hopechart IoT TechnologyLtd, take a look at this free data-rich visualisation to see how the company stacks up on earnings, revenue and cash flow.How Is Hangzhou Hopechart IoT TechnologyLtd's Revenue Growth Trending?
In order to justify its P/S ratio, Hangzhou Hopechart IoT TechnologyLtd would need to produce growth that's similar to the industry.
Retrospectively, the last year delivered an exceptional 32% gain to the company's top line. Despite this strong recent growth, it's still struggling to catch up as its three-year revenue frustratingly shrank by 16% overall. Therefore, it's fair to say the revenue growth recently has been undesirable for the company.
In contrast to the company, the rest of the industry is expected to grow by 35% over the next year, which really puts the company's recent medium-term revenue decline into perspective.
With this information, we find it concerning that Hangzhou Hopechart IoT TechnologyLtd is trading at a fairly similar P/S compared to the industry. Apparently many investors in the company are way less bearish than recent times would indicate and aren't willing to let go of their stock right now. Only the boldest would assume these prices are sustainable as a continuation of recent revenue trends is likely to weigh on the share price eventually.
The Bottom Line On Hangzhou Hopechart IoT TechnologyLtd's P/S
Hangzhou Hopechart IoT TechnologyLtd's plummeting stock price has brought its P/S back to a similar region as the rest of the industry. It's argued the price-to-sales ratio is an inferior measure of value within certain industries, but it can be a powerful business sentiment indicator.
We find it unexpected that Hangzhou Hopechart IoT TechnologyLtd trades at a P/S ratio that is comparable to the rest of the industry, despite experiencing declining revenues during the medium-term, while the industry as a whole is expected to grow. When we see revenue heading backwards in the context of growing industry forecasts, it'd make sense to expect a possible share price decline on the horizon, sending the moderate P/S lower. If recent medium-term revenue trends continue, it will place shareholders' investments at risk and potential investors in danger of paying an unnecessary premium.
You always need to take note of risks, for example - Hangzhou Hopechart IoT TechnologyLtd has 1 warning sign we think you should be aware of.
If companies with solid past earnings growth is up your alley, you may wish to see this free collection of other companies with strong earnings growth and low P/E ratios.
Have feedback on this article? Concerned about the content? Get in touch with us directly. Alternatively, email editorial-team (at) simplywallst.com.
This article by Simply Wall St is general in nature. We provide commentary based on historical data and analyst forecasts only using an unbiased methodology and our articles are not intended to be financial advice. It does not constitute a recommendation to buy or sell any stock, and does not take account of your objectives, or your financial situation. We aim to bring you long-term focused analysis driven by fundamental data. Note that our analysis may not factor in the latest price-sensitive company announcements or qualitative material. Simply Wall St has no position in any stocks mentioned.