
Harbin Xinguang Optic-Electronics Technology Co.,Ltd. (SHSE:688011) shareholders that were waiting for something to happen have been dealt a blow with a 26% share price drop in the last month. The drop over the last 30 days has capped off a tough year for shareholders, with the share price down 28% in that time.
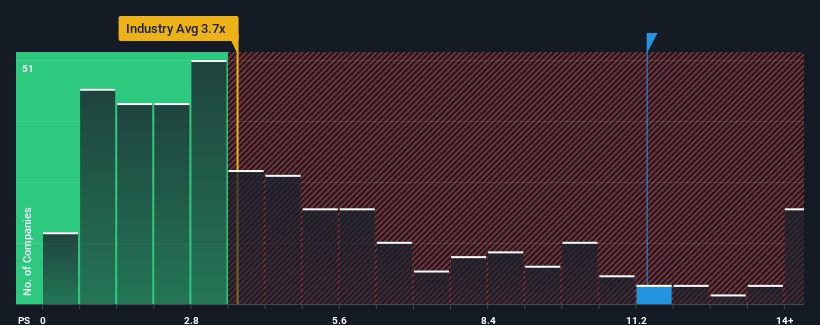
In spite of the heavy fall in price, when almost half of the companies in China's Electronic industry have price-to-sales ratios (or "P/S") below 3.7x, you may still consider Harbin Xinguang Optic-Electronics TechnologyLtd as a stock not worth researching with its 11.4x P/S ratio. Nonetheless, we'd need to dig a little deeper to determine if there is a rational basis for the highly elevated P/S.
Check out our latest analysis for Harbin Xinguang Optic-Electronics TechnologyLtd
What Does Harbin Xinguang Optic-Electronics TechnologyLtd's Recent Performance Look Like?
Revenue has risen firmly for Harbin Xinguang Optic-Electronics TechnologyLtd recently, which is pleasing to see. Perhaps the market is expecting this decent revenue performance to beat out the industry over the near term, which has kept the P/S propped up. If not, then existing shareholders may be a little nervous about the viability of the share price.
Although there are no analyst estimates available for Harbin Xinguang Optic-Electronics TechnologyLtd, take a look at this free data-rich visualisation to see how the company stacks up on earnings, revenue and cash flow.Do Revenue Forecasts Match The High P/S Ratio?
There's an inherent assumption that a company should far outperform the industry for P/S ratios like Harbin Xinguang Optic-Electronics TechnologyLtd's to be considered reasonable.
Retrospectively, the last year delivered an exceptional 21% gain to the company's top line. Still, revenue has fallen 6.6% in total from three years ago, which is quite disappointing. So unfortunately, we have to acknowledge that the company has not done a great job of growing revenues over that time.
Comparing that to the industry, which is predicted to deliver 60% growth in the next 12 months, the company's downward momentum based on recent medium-term revenue results is a sobering picture.
In light of this, it's alarming that Harbin Xinguang Optic-Electronics TechnologyLtd's P/S sits above the majority of other companies. Apparently many investors in the company are way more bullish than recent times would indicate and aren't willing to let go of their stock at any price. There's a very good chance existing shareholders are setting themselves up for future disappointment if the P/S falls to levels more in line with the recent negative growth rates.
The Bottom Line On Harbin Xinguang Optic-Electronics TechnologyLtd's P/S
A significant share price dive has done very little to deflate Harbin Xinguang Optic-Electronics TechnologyLtd's very lofty P/S. We'd say the price-to-sales ratio's power isn't primarily as a valuation instrument but rather to gauge current investor sentiment and future expectations.
Our examination of Harbin Xinguang Optic-Electronics TechnologyLtd revealed its shrinking revenue over the medium-term isn't resulting in a P/S as low as we expected, given the industry is set to grow. Right now we aren't comfortable with the high P/S as this revenue performance is highly unlikely to support such positive sentiment for long. Should recent medium-term revenue trends persist, it would pose a significant risk to existing shareholders' investments and prospective investors will have a hard time accepting the current value of the stock.
It is also worth noting that we have found 1 warning sign for Harbin Xinguang Optic-Electronics TechnologyLtd that you need to take into consideration.
If these risks are making you reconsider your opinion on Harbin Xinguang Optic-Electronics TechnologyLtd, explore our interactive list of high quality stocks to get an idea of what else is out there.
Have feedback on this article? Concerned about the content? Get in touch with us directly. Alternatively, email editorial-team (at) simplywallst.com.
This article by Simply Wall St is general in nature. We provide commentary based on historical data and analyst forecasts only using an unbiased methodology and our articles are not intended to be financial advice. It does not constitute a recommendation to buy or sell any stock, and does not take account of your objectives, or your financial situation. We aim to bring you long-term focused analysis driven by fundamental data. Note that our analysis may not factor in the latest price-sensitive company announcements or qualitative material. Simply Wall St has no position in any stocks mentioned.