
If we want to find a potential multi-bagger, often there are underlying trends that can provide clues. One common approach is to try and find a company with returns on capital employed (ROCE) that are increasing, in conjunction with a growing amount of capital employed. Ultimately, this demonstrates that it's a business that is reinvesting profits at increasing rates of return. In light of that, when we looked at Shang Gong Group (SHSE:600843) and its ROCE trend, we weren't exactly thrilled.
What Is Return On Capital Employed (ROCE)?
Just to clarify if you're unsure, ROCE is a metric for evaluating how much pre-tax income (in percentage terms) a company earns on the capital invested in its business. To calculate this metric for Shang Gong Group, this is the formula:
Return on Capital Employed = Earnings Before Interest and Tax (EBIT) ÷ (Total Assets - Current Liabilities)
 0.034 = CN¥140m ÷ (CN¥6.0b - CN¥2.0b) (Based on the trailing twelve months to September 2023).
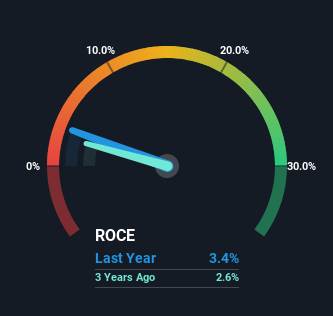
Thus, Shang Gong Group has an ROCE of 3.4%. In absolute terms, that's a low return and it also under-performs the Machinery industry average of 6.1%.
See our latest analysis for Shang Gong Group
While the past is not representative of the future, it can be helpful to know how a company has performed historically, which is why we have this chart above. If you're interested in investigating Shang Gong Group's past further, check out this free graph of past earnings, revenue and cash flow.
The Trend Of ROCE
In terms of Shang Gong Group's historical ROCE movements, the trend isn't fantastic. Over the last five years, returns on capital have decreased to 3.4% from 6.4% five years ago. However, given capital employed and revenue have both increased it appears that the business is currently pursuing growth, at the consequence of short term returns. And if the increased capital generates additional returns, the business, and thus shareholders, will benefit in the long run.
Our Take On Shang Gong Group's ROCE
While returns have fallen for Shang Gong Group in recent times, we're encouraged to see that sales are growing and that the business is reinvesting in its operations. And there could be an opportunity here if other metrics look good too, because the stock has declined 16% in the last five years. As a result, we'd recommend researching this stock further to uncover what other fundamentals of the business can show us.
One final note, you should learn about the 3 warning signs we've spotted with Shang Gong Group (including 1 which doesn't sit too well with us) .
If you want to search for solid companies with great earnings, check out this free list of companies with good balance sheets and impressive returns on equity.
Have feedback on this article? Concerned about the content? Get in touch with us directly. Alternatively, email editorial-team (at) simplywallst.com.
This article by Simply Wall St is general in nature. We provide commentary based on historical data and analyst forecasts only using an unbiased methodology and our articles are not intended to be financial advice. It does not constitute a recommendation to buy or sell any stock, and does not take account of your objectives, or your financial situation. We aim to bring you long-term focused analysis driven by fundamental data. Note that our analysis may not factor in the latest price-sensitive company announcements or qualitative material. Simply Wall St has no position in any stocks mentioned.