
When we invest, we're generally looking for stocks that outperform the market average. And in our experience, buying the right stocks can give your wealth a significant boost. To wit, the Xinjiang GuannongLtd share price has climbed 72% in five years, easily topping the market return of 18% (ignoring dividends).
While this past week has detracted from the company's five-year return, let's look at the recent trends of the underlying business and see if the gains have been in alignment.
See our latest analysis for Xinjiang GuannongLtd
To paraphrase Benjamin Graham: Over the short term the market is a voting machine, but over the long term it's a weighing machine. By comparing earnings per share (EPS) and share price changes over time, we can get a feel for how investor attitudes to a company have morphed over time.
Over half a decade, Xinjiang GuannongLtd managed to grow its earnings per share at 47% a year. The EPS growth is more impressive than the yearly share price gain of 11% over the same period. Therefore, it seems the market has become relatively pessimistic about the company. The reasonably low P/E ratio of 7.49 also suggests market apprehension.
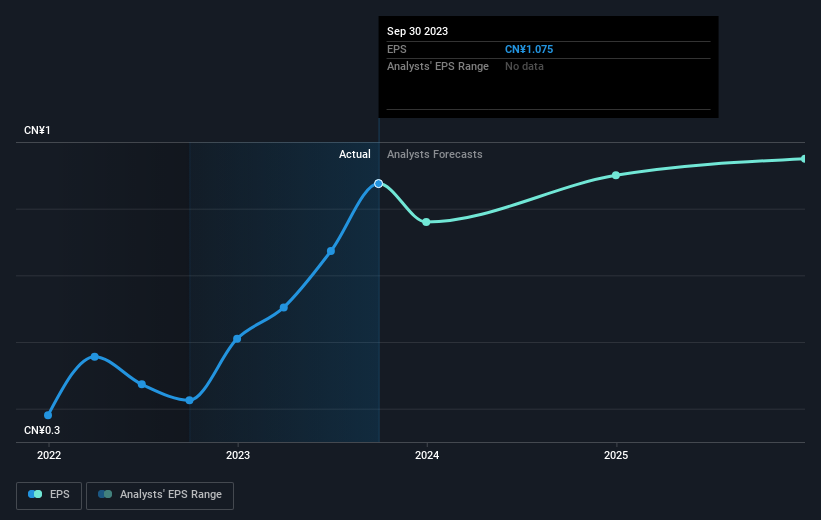
The company's earnings per share (over time) is depicted in the image below (click to see the exact numbers).
It's probably worth noting that the CEO is paid less than the median at similar sized companies. But while CEO remuneration is always worth checking, the really important question is whether the company can grow earnings going forward. Before buying or selling a stock, we always recommend a close examination of historic growth trends, available here..
What About Dividends?
When looking at investment returns, it is important to consider the difference between total shareholder return (TSR) and share price return. The TSR incorporates the value of any spin-offs or discounted capital raisings, along with any dividends, based on the assumption that the dividends are reinvested. Arguably, the TSR gives a more comprehensive picture of the return generated by a stock. We note that for Xinjiang GuannongLtd the TSR over the last 5 years was 78%, which is better than the share price return mentioned above. The dividends paid by the company have thusly boosted the total shareholder return.
A Different Perspective
While it's certainly disappointing to see that Xinjiang GuannongLtd shares lost 6.0% throughout the year, that wasn't as bad as the market loss of 21%. Longer term investors wouldn't be so upset, since they would have made 12%, each year, over five years. In the best case scenario the last year is just a temporary blip on the journey to a brighter future. I find it very interesting to look at share price over the long term as a proxy for business performance. But to truly gain insight, we need to consider other information, too. To that end, you should learn about the 2 warning signs we've spotted with Xinjiang GuannongLtd (including 1 which is significant) .
If you are like me, then you will not want to miss this free list of growing companies that insiders are buying.
Please note, the market returns quoted in this article reflect the market weighted average returns of stocks that currently trade on Chinese exchanges.
Have feedback on this article? Concerned about the content? Get in touch with us directly. Alternatively, email editorial-team (at) simplywallst.com.
This article by Simply Wall St is general in nature. We provide commentary based on historical data and analyst forecasts only using an unbiased methodology and our articles are not intended to be financial advice. It does not constitute a recommendation to buy or sell any stock, and does not take account of your objectives, or your financial situation. We aim to bring you long-term focused analysis driven by fundamental data. Note that our analysis may not factor in the latest price-sensitive company announcements or qualitative material. Simply Wall St has no position in any stocks mentioned.