
The most you can lose on any stock (assuming you don't use leverage) is 100% of your money. But on a lighter note, a good company can see its share price rise well over 100%. One great example is KPC Pharmaceuticals,Inc (SHSE:600422) which saw its share price drive 196% higher over five years. In contrast, the stock has fallen 8.1% in the last 30 days. This could be related to the soft market, with stocks down around 7.7% in the last month.
Since the long term performance has been good but there's been a recent pullback of 7.1%, let's check if the fundamentals match the share price.
View our latest analysis for KPC PharmaceuticalsInc
In his essay The Superinvestors of Graham-and-Doddsville Warren Buffett described how share prices do not always rationally reflect the value of a business. One way to examine how market sentiment has changed over time is to look at the interaction between a company's share price and its earnings per share (EPS).
During five years of share price growth, KPC PharmaceuticalsInc achieved compound earnings per share (EPS) growth of 5.4% per year. This EPS growth is lower than the 24% average annual increase in the share price. This suggests that market participants hold the company in higher regard, these days. That's not necessarily surprising considering the five-year track record of earnings growth.
The graphic below depicts how EPS has changed over time (unveil the exact values by clicking on the image).
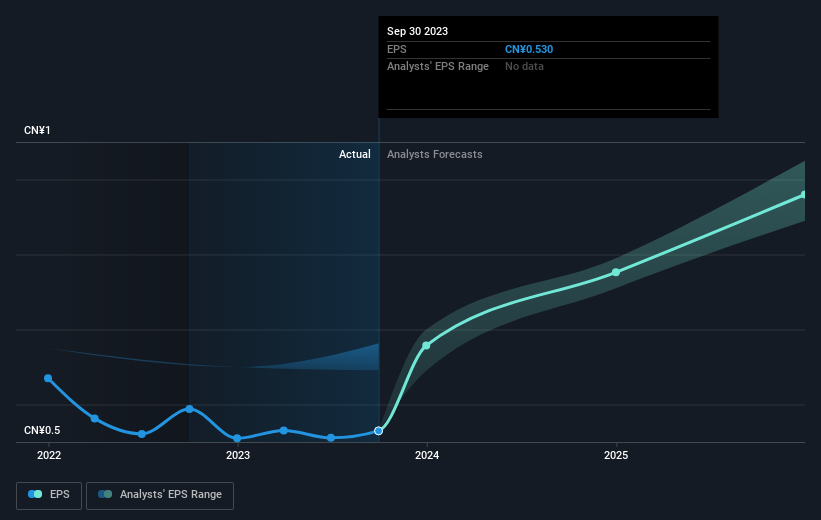
Dive deeper into KPC PharmaceuticalsInc's key metrics by checking this interactive graph of KPC PharmaceuticalsInc's earnings, revenue and cash flow.
What About Dividends?
It is important to consider the total shareholder return, as well as the share price return, for any given stock. Whereas the share price return only reflects the change in the share price, the TSR includes the value of dividends (assuming they were reinvested) and the benefit of any discounted capital raising or spin-off. Arguably, the TSR gives a more comprehensive picture of the return generated by a stock. As it happens, KPC PharmaceuticalsInc's TSR for the last 5 years was 223%, which exceeds the share price return mentioned earlier. And there's no prize for guessing that the dividend payments largely explain the divergence!
A Different Perspective
It's nice to see that KPC PharmaceuticalsInc shareholders have received a total shareholder return of 9.7% over the last year. And that does include the dividend. However, that falls short of the 26% TSR per annum it has made for shareholders, each year, over five years. The pessimistic view would be that be that the stock has its best days behind it, but on the other hand the price might simply be moderating while the business itself continues to execute. It's always interesting to track share price performance over the longer term. But to understand KPC PharmaceuticalsInc better, we need to consider many other factors. Consider risks, for instance. Every company has them, and we've spotted 1 warning sign for KPC PharmaceuticalsInc you should know about.
For those who like to find winning investments this free list of growing companies with recent insider purchasing, could be just the ticket.
Please note, the market returns quoted in this article reflect the market weighted average returns of stocks that currently trade on Chinese exchanges.
Have feedback on this article? Concerned about the content? Get in touch with us directly. Alternatively, email editorial-team (at) simplywallst.com.
This article by Simply Wall St is general in nature. We provide commentary based on historical data and analyst forecasts only using an unbiased methodology and our articles are not intended to be financial advice. It does not constitute a recommendation to buy or sell any stock, and does not take account of your objectives, or your financial situation. We aim to bring you long-term focused analysis driven by fundamental data. Note that our analysis may not factor in the latest price-sensitive company announcements or qualitative material. Simply Wall St has no position in any stocks mentioned.