
Those holding The InterGroup Corporation (NASDAQ:INTG) shares would be relieved that the share price has rebounded 51% in the last thirty days, but it needs to keep going to repair the recent damage it has caused to investor portfolios. Not all shareholders will be feeling jubilant, since the share price is still down a very disappointing 42% in the last twelve months.
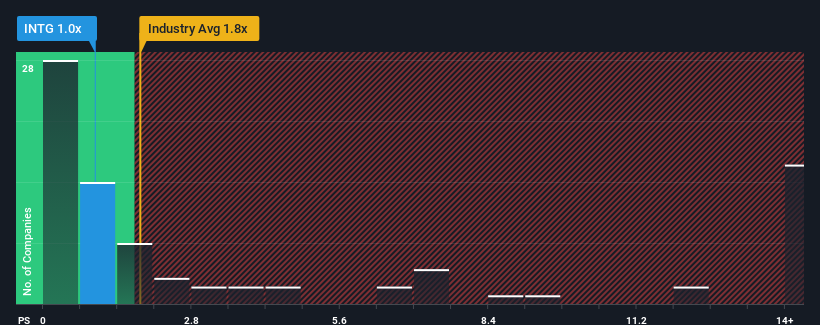
Even after such a large jump in price, InterGroup's price-to-sales (or "P/S") ratio of 1x might still make it look like a buy right now compared to the Real Estate industry in the United States, where around half of the companies have P/S ratios above 1.8x and even P/S above 9x are quite common. Nonetheless, we'd need to dig a little deeper to determine if there is a rational basis for the reduced P/S.
View our latest analysis for InterGroup
What Does InterGroup's Recent Performance Look Like?
 Revenue has risen firmly for InterGroup recently, which is pleasing to see. Perhaps the market is expecting this acceptable revenue performance to take a dive, which has kept the P/S suppressed. Those who are bullish on InterGroup will be hoping that this isn't the case, so that they can pick up the stock at a lower valuation.
What Are Revenue Growth Metrics Telling Us About The Low P/S?
In order to justify its P/S ratio, InterGroup would need to produce sluggish growth that's trailing the industry.
If we review the last year of revenue growth, the company posted a worthy increase of 7.7%. The latest three year period has also seen a 24% overall rise in revenue, aided somewhat by its short-term performance. So we can start by confirming that the company has actually done a good job of growing revenue over that time.
Comparing that to the industry, which is predicted to deliver 10% growth in the next 12 months, the company's momentum is weaker, based on recent medium-term annualised revenue results.
With this information, we can see why InterGroup is trading at a P/S lower than the industry. Apparently many shareholders weren't comfortable holding on to something they believe will continue to trail the wider industry.
What We Can Learn From InterGroup's P/S?
Despite InterGroup's share price climbing recently, its P/S still lags most other companies. While the price-to-sales ratio shouldn't be the defining factor in whether you buy a stock or not, it's quite a capable barometer of revenue expectations.
Our examination of InterGroup confirms that the company's revenue trends over the past three-year years are a key factor in its low price-to-sales ratio, as we suspected, given they fall short of current industry expectations. At this stage investors feel the potential for an improvement in revenue isn't great enough to justify a higher P/S ratio. If recent medium-term revenue trends continue, it's hard to see the share price experience a reversal of fortunes anytime soon.
Having said that, be aware InterGroup is showing 4 warning signs in our investment analysis, and 2 of those are concerning.
If companies with solid past earnings growth is up your alley, you may wish to see this free collection of other companies with strong earnings growth and low P/E ratios.
Have feedback on this article? Concerned about the content? Get in touch with us directly. Alternatively, email editorial-team (at) simplywallst.com.
This article by Simply Wall St is general in nature. We provide commentary based on historical data and analyst forecasts only using an unbiased methodology and our articles are not intended to be financial advice. It does not constitute a recommendation to buy or sell any stock, and does not take account of your objectives, or your financial situation. We aim to bring you long-term focused analysis driven by fundamental data. Note that our analysis may not factor in the latest price-sensitive company announcements or qualitative material. Simply Wall St has no position in any stocks mentioned.
