
One simple way to benefit from a rising market is to buy an index fund. By comparison, an individual stock is unlikely to match market returns - and could well fall short. One such example is Black Peony (Group) Co., Ltd. (SHSE:600510), which saw its share price fall 22% over a year, against a market decline of 17%. At least the damage isn't so bad if you look at the last three years, since the stock is down 16% in that time. And the share price decline continued over the last week, dropping some 6.7%.
Given the past week has been tough on shareholders, let's investigate the fundamentals and see what we can learn.
View our latest analysis for Black Peony (Group)
In his essay The Superinvestors of Graham-and-Doddsville Warren Buffett described how share prices do not always rationally reflect the value of a business. By comparing earnings per share (EPS) and share price changes over time, we can get a feel for how investor attitudes to a company have morphed over time.
During the unfortunate twelve months during which the Black Peony (Group) share price fell, it actually saw its earnings per share (EPS) improve by 192%. It could be that the share price was previously over-hyped.
The divergence between the EPS and the share price is quite notable, during the year. But we might find some different metrics explain the share price movements better.
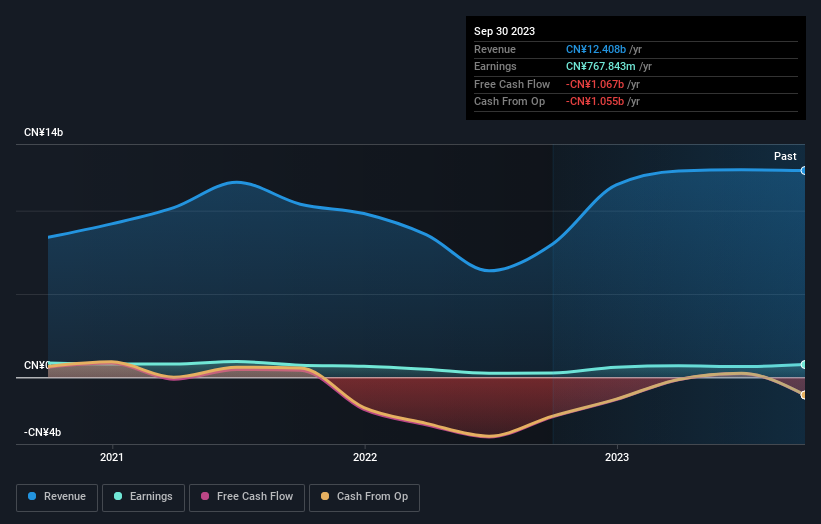
Black Peony (Group) managed to grow revenue over the last year, which is usually a real positive. Since the fundamental metrics don't readily explain the share price drop, there might be an opportunity if the market has overreacted.
The company's revenue and earnings (over time) are depicted in the image below (click to see the exact numbers).
If you are thinking of buying or selling Black Peony (Group) stock, you should check out this FREE detailed report on its balance sheet.
What About Dividends?
It is important to consider the total shareholder return, as well as the share price return, for any given stock. The TSR is a return calculation that accounts for the value of cash dividends (assuming that any dividend received was reinvested) and the calculated value of any discounted capital raisings and spin-offs. Arguably, the TSR gives a more comprehensive picture of the return generated by a stock. As it happens, Black Peony (Group)'s TSR for the last 1 year was -19%, which exceeds the share price return mentioned earlier. This is largely a result of its dividend payments!
A Different Perspective
We regret to report that Black Peony (Group) shareholders are down 19% for the year (even including dividends). Unfortunately, that's worse than the broader market decline of 17%. However, it could simply be that the share price has been impacted by broader market jitters. It might be worth keeping an eye on the fundamentals, in case there's a good opportunity. On the bright side, long term shareholders have made money, with a gain of 0.8% per year over half a decade. If the fundamental data continues to indicate long term sustainable growth, the current sell-off could be an opportunity worth considering. While it is well worth considering the different impacts that market conditions can have on the share price, there are other factors that are even more important. Take risks, for example - Black Peony (Group) has 3 warning signs (and 2 which can't be ignored) we think you should know about.
Of course Black Peony (Group) may not be the best stock to buy. So you may wish to see this free collection of growth stocks.
Please note, the market returns quoted in this article reflect the market weighted average returns of stocks that currently trade on Chinese exchanges.
Have feedback on this article? Concerned about the content? Get in touch with us directly. Alternatively, email editorial-team (at) simplywallst.com.
This article by Simply Wall St is general in nature. We provide commentary based on historical data and analyst forecasts only using an unbiased methodology and our articles are not intended to be financial advice. It does not constitute a recommendation to buy or sell any stock, and does not take account of your objectives, or your financial situation. We aim to bring you long-term focused analysis driven by fundamental data. Note that our analysis may not factor in the latest price-sensitive company announcements or qualitative material. Simply Wall St has no position in any stocks mentioned.