
Passive investing in an index fund is a good way to ensure your own returns roughly match the overall market. While individual stocks can be big winners, plenty more fail to generate satisfactory returns. That downside risk was realized by Zhejiang Xinan Chemical Industrial Group Co.,Ltd (SHSE:600596) shareholders over the last year, as the share price declined 46%. That's disappointing when you consider the market declined 17%. Longer term investors have fared much better, since the share price is up 4.7% in three years. The falls have accelerated recently, with the share price down 11% in the last three months. However, one could argue that the price has been influenced by the general market, which is down 6.6% in the same timeframe.
Given the past week has been tough on shareholders, let's investigate the fundamentals and see what we can learn.
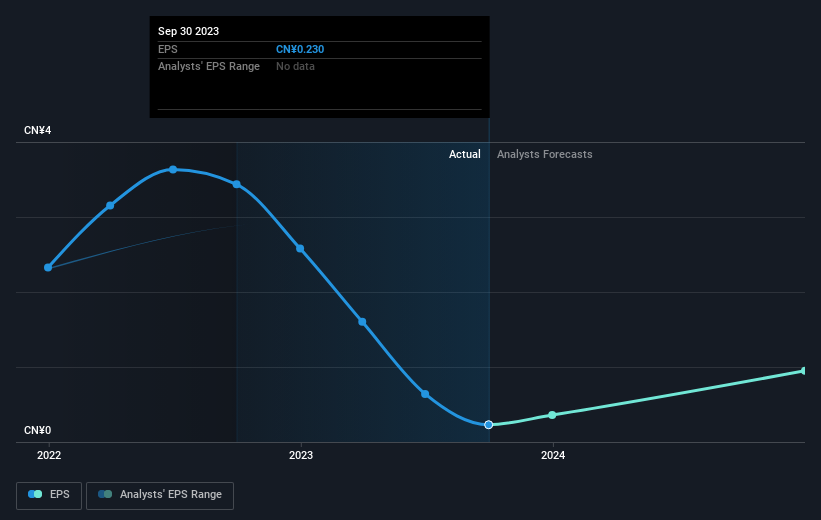
Check out our latest analysis for Zhejiang Xinan Chemical Industrial GroupLtd
While markets are a powerful pricing mechanism, share prices reflect investor sentiment, not just underlying business performance. One imperfect but simple way to consider how the market perception of a company has shifted is to compare the change in the earnings per share (EPS) with the share price movement.
Unfortunately Zhejiang Xinan Chemical Industrial GroupLtd reported an EPS drop of 93% for the last year. The share price fall of 46% isn't as bad as the reduction in earnings per share. So despite the weak per-share profits, some investors are probably relieved the situation wasn't more difficult.
You can see below how EPS has changed over time (discover the exact values by clicking on the image).
It might be well worthwhile taking a look at our free report on Zhejiang Xinan Chemical Industrial GroupLtd's earnings, revenue and cash flow.
What About Dividends?
As well as measuring the share price return, investors should also consider the total shareholder return (TSR). The TSR is a return calculation that accounts for the value of cash dividends (assuming that any dividend received was reinvested) and the calculated value of any discounted capital raisings and spin-offs. Arguably, the TSR gives a more comprehensive picture of the return generated by a stock. As it happens, Zhejiang Xinan Chemical Industrial GroupLtd's TSR for the last 1 year was -42%, which exceeds the share price return mentioned earlier. This is largely a result of its dividend payments!
A Different Perspective
We regret to report that Zhejiang Xinan Chemical Industrial GroupLtd shareholders are down 42% for the year (even including dividends). Unfortunately, that's worse than the broader market decline of 17%. Having said that, it's inevitable that some stocks will be oversold in a falling market. The key is to keep your eyes on the fundamental developments. Longer term investors wouldn't be so upset, since they would have made 6%, each year, over five years. If the fundamental data continues to indicate long term sustainable growth, the current sell-off could be an opportunity worth considering. While it is well worth considering the different impacts that market conditions can have on the share price, there are other factors that are even more important. For example, we've discovered 3 warning signs for Zhejiang Xinan Chemical Industrial GroupLtd (1 is concerning!) that you should be aware of before investing here.
Of course Zhejiang Xinan Chemical Industrial GroupLtd may not be the best stock to buy. So you may wish to see this free collection of growth stocks.
Please note, the market returns quoted in this article reflect the market weighted average returns of stocks that currently trade on Chinese exchanges.
Have feedback on this article? Concerned about the content? Get in touch with us directly. Alternatively, email editorial-team (at) simplywallst.com.
This article by Simply Wall St is general in nature. We provide commentary based on historical data and analyst forecasts only using an unbiased methodology and our articles are not intended to be financial advice. It does not constitute a recommendation to buy or sell any stock, and does not take account of your objectives, or your financial situation. We aim to bring you long-term focused analysis driven by fundamental data. Note that our analysis may not factor in the latest price-sensitive company announcements or qualitative material. Simply Wall St has no position in any stocks mentioned.