
Investors can earn very close to the average market return by buying an index fund. By comparison, an individual stock is unlikely to match market returns - and could well fall short. The Xinjiang Tianye Co.,Ltd. (SHSE:600075) is such an example; over three years its share price is down 32% versus a marketdecline of 25%. And the ride hasn't got any smoother in recent times over the last year, with the price 28% lower in that time. Shareholders have had an even rougher run lately, with the share price down 10% in the last 90 days. However, one could argue that the price has been influenced by the general market, which is down 6.6% in the same timeframe.
Since Xinjiang TianyeLtd has shed CN¥376m from its value in the past 7 days, let's see if the longer term decline has been driven by the business' economics.
See our latest analysis for Xinjiang TianyeLtd
 To paraphrase Benjamin Graham: Over the short term the market is a voting machine, but over the long term it's a weighing machine. One imperfect but simple way to consider how the market perception of a company has shifted is to compare the change in the earnings per share (EPS) with the share price movement.
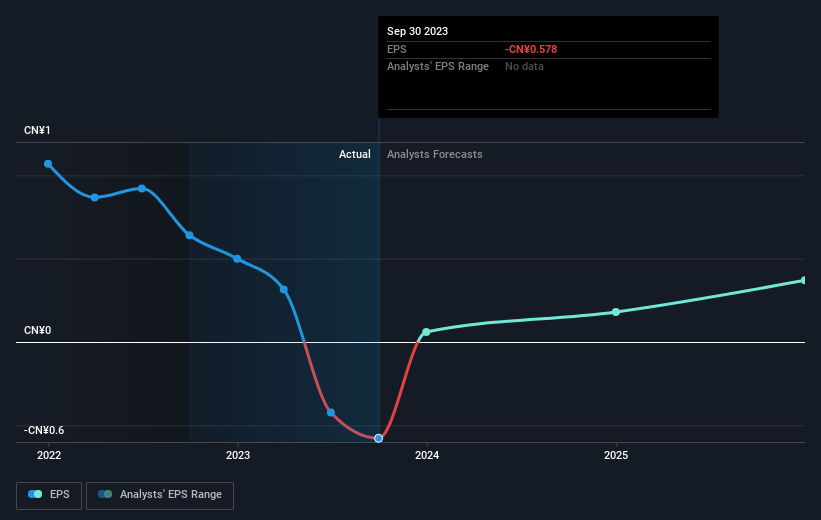
Over the three years that the share price declined, Xinjiang TianyeLtd's earnings per share (EPS) dropped significantly, falling to a loss. Due to the loss, it's not easy to use EPS as a reliable guide to the business. But it's safe to say we'd generally expect the share price to be lower as a result!
You can see below how EPS has changed over time (discover the exact values by clicking on the image).
We're pleased to report that the CEO is remunerated more modestly than most CEOs at similarly capitalized companies. But while CEO remuneration is always worth checking, the really important question is whether the company can grow earnings going forward. Before buying or selling a stock, we always recommend a close examination of historic growth trends, available here..
What About Dividends?
When looking at investment returns, it is important to consider the difference between total shareholder return (TSR) and share price return. The TSR is a return calculation that accounts for the value of cash dividends (assuming that any dividend received was reinvested) and the calculated value of any discounted capital raisings and spin-offs. Arguably, the TSR gives a more comprehensive picture of the return generated by a stock. As it happens, Xinjiang TianyeLtd's TSR for the last 3 years was -28%, which exceeds the share price return mentioned earlier. The dividends paid by the company have thusly boosted the total shareholder return.
A Different Perspective
We regret to report that Xinjiang TianyeLtd shareholders are down 27% for the year (even including dividends). Unfortunately, that's worse than the broader market decline of 17%. Having said that, it's inevitable that some stocks will be oversold in a falling market. The key is to keep your eyes on the fundamental developments. Regrettably, last year's performance caps off a bad run, with the shareholders facing a total loss of 2% per year over five years. We realise that Baron Rothschild has said investors should "buy when there is blood on the streets", but we caution that investors should first be sure they are buying a high quality business. It's always interesting to track share price performance over the longer term. But to understand Xinjiang TianyeLtd better, we need to consider many other factors. Take risks, for example - Xinjiang TianyeLtd has 2 warning signs we think you should be aware of.
Of course Xinjiang TianyeLtd may not be the best stock to buy. So you may wish to see this free collection of growth stocks.
Please note, the market returns quoted in this article reflect the market weighted average returns of stocks that currently trade on Chinese exchanges.
Have feedback on this article? Concerned about the content? Get in touch with us directly. Alternatively, email editorial-team (at) simplywallst.com.
This article by Simply Wall St is general in nature. We provide commentary based on historical data and analyst forecasts only using an unbiased methodology and our articles are not intended to be financial advice. It does not constitute a recommendation to buy or sell any stock, and does not take account of your objectives, or your financial situation. We aim to bring you long-term focused analysis driven by fundamental data. Note that our analysis may not factor in the latest price-sensitive company announcements or qualitative material. Simply Wall St has no position in any stocks mentioned.
