
 Yahoo Finance
 Investors in Hiap Teck Venture Berhad (KLSE:HIAPTEK) have seen favorable returns of 51% over the past five years
Hiap Teck Venture Berhad (KLSE:HIAPTEK) shareholders might be concerned after seeing the share price drop 11% in the last quarter. Looking further back, the stock has generated good profits over five years. It has returned a market beating 38% in that time.
Let's take a look at the underlying fundamentals over the longer term, and see if they've been consistent with shareholders returns.
View our latest analysis for Hiap Teck Venture Berhad
There is no denying that markets are sometimes efficient, but prices do not always reflect underlying business performance. By comparing earnings per share (EPS) and share price changes over time, we can get a feel for how investor attitudes to a company have morphed over time.
Over half a decade, Hiap Teck Venture Berhad managed to grow its earnings per share at 19% a year. The EPS growth is more impressive than the yearly share price gain of 7% over the same period. So it seems the market isn't so enthusiastic about the stock these days. The reasonably low P/E ratio of 9.50 also suggests market apprehension.
You can see below how EPS has changed over time (discover the exact values by clicking on the image).
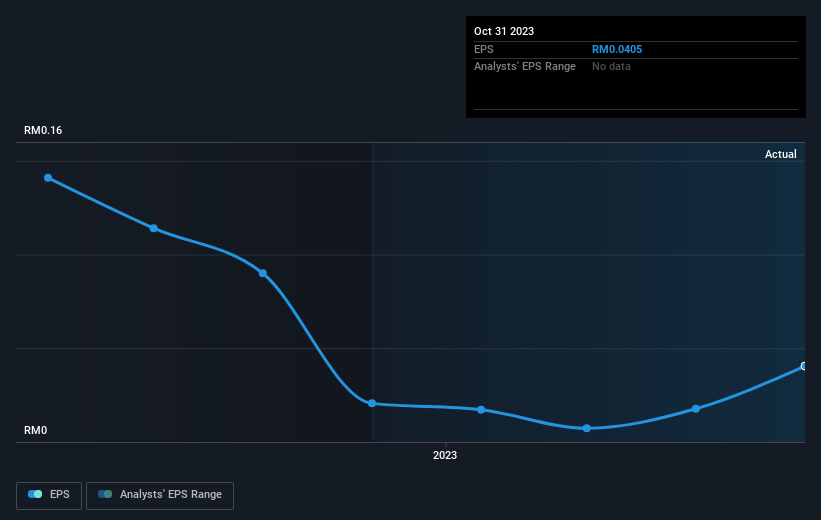
This free interactive report on Hiap Teck Venture Berhad's earnings, revenue and cash flow is a great place to start, if you want to investigate the stock further.
What About Dividends?
It is important to consider the total shareholder return, as well as the share price return, for any given stock. Whereas the share price return only reflects the change in the share price, the TSR includes the value of dividends (assuming they were reinvested) and the benefit of any discounted capital raising or spin-off. So for companies that pay a generous dividend, the TSR is often a lot higher than the share price return. In the case of Hiap Teck Venture Berhad, it has a TSR of 51% for the last 5 years. That exceeds its share price return that we previously mentioned. This is largely a result of its dividend payments!
A Different Perspective
It's good to see that Hiap Teck Venture Berhad has rewarded shareholders with a total shareholder return of 26% in the last twelve months. Of course, that includes the dividend. That's better than the annualised return of 9% over half a decade, implying that the company is doing better recently. Someone with an optimistic perspective could view the recent improvement in TSR as indicating that the business itself is getting better with time. Before forming an opinion on Hiap Teck Venture Berhad you might want to consider these 3 valuation metrics.
If you are like me, then you will not want to miss this free list of growing companies that insiders are buying.
Please note, the market returns quoted in this article reflect the market weighted average returns of stocks that currently trade on Malaysian exchanges.
Have feedback on this article? Concerned about the content? Get in touch with us directly. Alternatively, email editorial-team (at) simplywallst.com.
This article by Simply Wall St is general in nature. We provide commentary based on historical data and analyst forecasts only using an unbiased methodology and our articles are not intended to be financial advice. It does not constitute a recommendation to buy or sell any stock, and does not take account of your objectives, or your financial situation. We aim to bring you long-term focused analysis driven by fundamental data. Note that our analysis may not factor in the latest price-sensitive company announcements or qualitative material. Simply Wall St has no position in any stocks mentioned.
