
 Yahoo Finance
 Capital Allocation Trends At Silverlake Axis (SGX:5CP) Aren't Ideal
There are a few key trends to look for if we want to identify the next multi-bagger. Firstly, we'll want to see a proven return on capital employed (ROCE) that is increasing, and secondly, an expanding base of capital employed. This shows us that it's a compounding machine, able to continually reinvest its earnings back into the business and generate higher returns. However, after investigating Silverlake Axis (SGX:5CP), we don't think it's current trends fit the mold of a multi-bagger.
Return On Capital Employed (ROCE): What Is It?
Just to clarify if you're unsure, ROCE is a metric for evaluating how much pre-tax income (in percentage terms) a company earns on the capital invested in its business. Analysts use this formula to calculate it for Silverlake Axis:
Return on Capital Employed = Earnings Before Interest and Tax (EBIT) ÷ (Total Assets - Current Liabilities)
0.16 = RM214m ÷ (RM1.6b - RM253m) (Based on the trailing twelve months to September 2023).
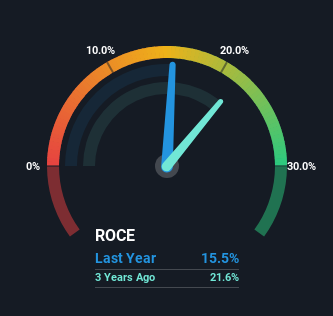
Therefore, Silverlake Axis has an ROCE of 16%. In absolute terms, that's a satisfactory return, but compared to the Software industry average of 9.3% it's much better.
Check out our latest analysis for Silverlake Axis
In the above chart we have measured Silverlake Axis' prior ROCE against its prior performance, but the future is arguably more important. If you're interested, you can view the analysts predictions in our free report on analyst forecasts for the company.
What The Trend Of ROCE Can Tell Us
In terms of Silverlake Axis' historical ROCE movements, the trend isn't fantastic. To be more specific, ROCE has fallen from 25% over the last five years. However it looks like Silverlake Axis might be reinvesting for long term growth because while capital employed has increased, the company's sales haven't changed much in the last 12 months. It's worth keeping an eye on the company's earnings from here on to see if these investments do end up contributing to the bottom line.
The Key Takeaway
To conclude, we've found that Silverlake Axis is reinvesting in the business, but returns have been falling. And investors appear hesitant that the trends will pick up because the stock has fallen 26% in the last five years. On the whole, we aren't too inspired by the underlying trends and we think there may be better chances of finding a multi-bagger elsewhere.
If you're still interested in Silverlake Axis it's worth checking out our FREE intrinsic value approximation to see if it's trading at an attractive price in other respects.
While Silverlake Axis isn't earning the highest return, check out this free list of companies that are earning high returns on equity with solid balance sheets.
Have feedback on this article? Concerned about the content? Get in touch with us directly. Alternatively, email editorial-team (at) simplywallst.com.
This article by Simply Wall St is general in nature. We provide commentary based on historical data and analyst forecasts only using an unbiased methodology and our articles are not intended to be financial advice. It does not constitute a recommendation to buy or sell any stock, and does not take account of your objectives, or your financial situation. We aim to bring you long-term focused analysis driven by fundamental data. Note that our analysis may not factor in the latest price-sensitive company announcements or qualitative material. Simply Wall St has no position in any stocks mentioned.
