
 Yahoo Finance
 Investing in Simonds Group (ASX:SIO) a year ago would have delivered you a 83% gain
These days it's easy to simply buy an index fund, and your returns should (roughly) match the market. But if you pick the right individual stocks, you could make more than that. For example, the Simonds Group Limited (ASX:SIO) share price is up 83% in the last 1 year, clearly besting the market return of around 3.9% (not including dividends). That's a solid performance by our standards! Unfortunately the longer term returns are not so good, with the stock falling 48% in the last three years.
Let's take a look at the underlying fundamentals over the longer term, and see if they've been consistent with shareholders returns.
See our latest analysis for Simonds Group
Given that Simonds Group didn't make a profit in the last twelve months, we'll focus on revenue growth to form a quick view of its business development. Shareholders of unprofitable companies usually expect strong revenue growth. Some companies are willing to postpone profitability to grow revenue faster, but in that case one does expect good top-line growth.
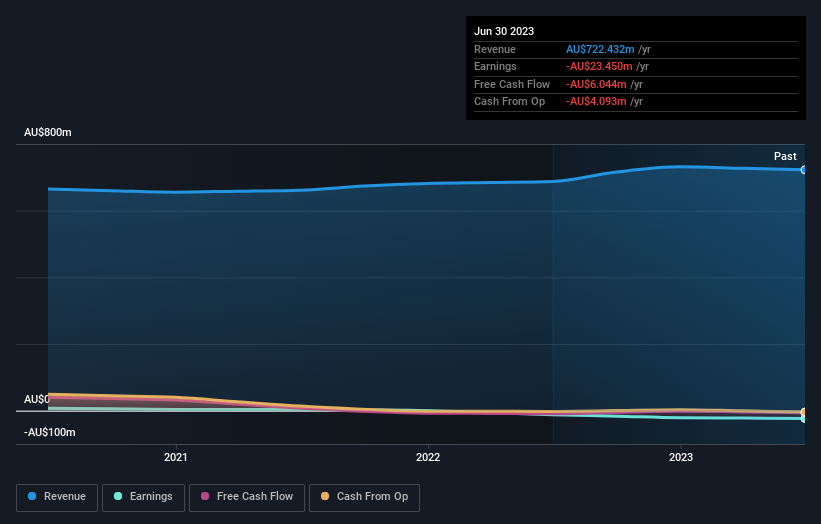
Simonds Group grew its revenue by 5.1% last year. That's not a very high growth rate considering it doesn't make profits. In keeping with the revenue growth, the share price gained 83% in that time. While not a huge gain tht seems pretty reasonable. Given the market doesn't seem too excited about the stock, a closer look at the financial data could pay off, if you can find indications of a stronger growth trend in the future.
The graphic below depicts how earnings and revenue have changed over time (unveil the exact values by clicking on the image).
You can see how its balance sheet has strengthened (or weakened) over time in this free interactive graphic.
A Different Perspective
It's nice to see that Simonds Group shareholders have received a total shareholder return of 83% over the last year. There's no doubt those recent returns are much better than the TSR loss of 6% per year over five years. The long term loss makes us cautious, but the short term TSR gain certainly hints at a brighter future. While it is well worth considering the different impacts that market conditions can have on the share price, there are other factors that are even more important. Take risks, for example - Simonds Group has 4 warning signs (and 2 which are significant) we think you should know about.
If you would prefer to check out another company -- one with potentially superior financials -- then do not miss this free list of companies that have proven they can grow earnings.
Please note, the market returns quoted in this article reflect the market weighted average returns of stocks that currently trade on Australian exchanges.
Have feedback on this article? Concerned about the content? Get in touch with us directly. Alternatively, email editorial-team (at) simplywallst.com.
This article by Simply Wall St is general in nature. We provide commentary based on historical data and analyst forecasts only using an unbiased methodology and our articles are not intended to be financial advice. It does not constitute a recommendation to buy or sell any stock, and does not take account of your objectives, or your financial situation. We aim to bring you long-term focused analysis driven by fundamental data. Note that our analysis may not factor in the latest price-sensitive company announcements or qualitative material. Simply Wall St has no position in any stocks mentioned.
