Shareholders Will Likely Find EVE Health Group Limited's (ASX:EVE) CEO Compensation Acceptable
Key Insights
EVE Health Group to hold its Annual General Meeting on 23rd of November
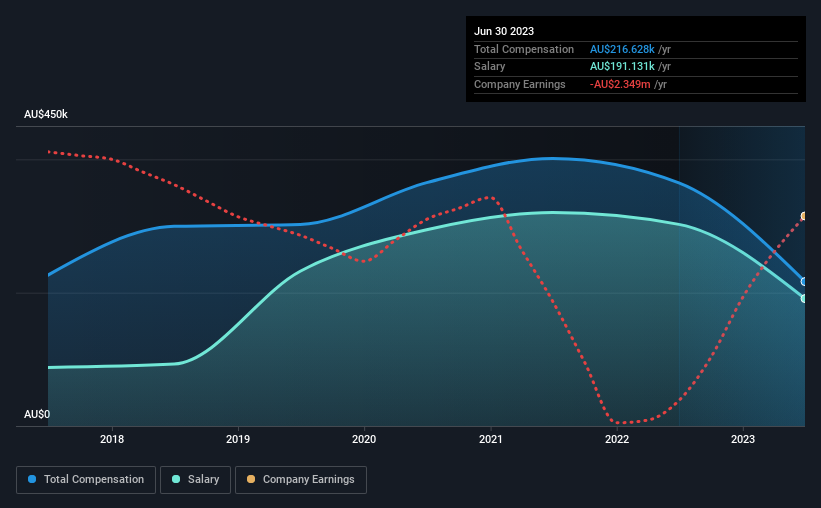
Total pay for CEO Bill Fry includes AU$191.1k salary
The overall pay is 49% below the industry average
EVE Health Group's three-year loss to shareholders was 87% while its EPS was down 6.0% over the past three years
The performance at EVE Health Group Limited (ASX:EVE) has been rather lacklustre of late and shareholders may be wondering what CEO Bill Fry is planning to do about this. They will get a chance to exercise their voting power to influence the future direction of the company in the next AGM on 23rd of November. It has been shown that setting appropriate executive remuneration incentivises the management to act in the interests of shareholders. We think CEO compensation looks appropriate given the data we have put together.
View our latest analysis for EVE Health Group
Comparing EVE Health Group Limited's CEO Compensation With The Industry
According to our data, EVE Health Group Limited has a market capitalization of AU$5.3m, and paid its CEO total annual compensation worth AU$217k over the year to June 2023. That's a notable decrease of 41% on last year. Notably, the salary which is AU$191.1k, represents most of the total compensation being paid.
For comparison, other companies in the Australian Food industry with market capitalizations below AU$309m, reported a median total CEO compensation of AU$425k. In other words, EVE Health Group pays its CEO lower than the industry median.
Component | 2023 | 2022 | Proportion (2023) |
Salary | AU$191k | AU$302k | 88% |
Other | AU$25k | AU$62k | 12% |
Total Compensation | AU$217k | AU$365k | 100% |
Speaking on an industry level, nearly 72% of total compensation represents salary, while the remainder of 28% is other remuneration. EVE Health Group pays out 88% of remuneration in the form of a salary, significantly higher than the industry average. If salary is the major component in total compensation, it suggests that the CEO receives a higher fixed proportion of the total compensation, regardless of performance.
EVE Health Group Limited's Growth
Over the last three years, EVE Health Group Limited has shrunk its earnings per share by 6.0% per year. It achieved revenue growth of 16% over the last year.
Investors would be a bit wary of companies that have lower EPS But on the other hand, revenue growth is strong, suggesting a brighter future. In conclusion we can't form a strong opinion about business performance yet; but it's one worth watching. While we don't have analyst forecasts for the company, shareholders might want to examine this detailed historical graph of earnings, revenue and cash flow.
Has EVE Health Group Limited Been A Good Investment?
The return of -87% over three years would not have pleased EVE Health Group Limited shareholders. Therefore, it might be upsetting for shareholders if the CEO were paid generously.
To Conclude...
The fact that shareholders are sitting on a loss is certainly disheartening. The poor performance of the share price might have something to do with the lack of earnings growth. The upcoming AGM will provide shareholders the opportunity to raise their concerns and evaluate if the board’s judgement and decision-making is aligned with their expectations.
We can learn a lot about a company by studying its CEO compensation trends, along with looking at other aspects of the business. We identified 5 warning signs for EVE Health Group (4 are a bit unpleasant!) that you should be aware of before investing here.
Switching gears from EVE Health Group, if you're hunting for a pristine balance sheet and premium returns, this free list of high return, low debt companies is a great place to look.
Have feedback on this article? Concerned about the content? Get in touch with us directly. Alternatively, email editorial-team (at) simplywallst.com.
This article by Simply Wall St is general in nature. We provide commentary based on historical data and analyst forecasts only using an unbiased methodology and our articles are not intended to be financial advice. It does not constitute a recommendation to buy or sell any stock, and does not take account of your objectives, or your financial situation. We aim to bring you long-term focused analysis driven by fundamental data. Note that our analysis may not factor in the latest price-sensitive company announcements or qualitative material. Simply Wall St has no position in any stocks mentioned.
